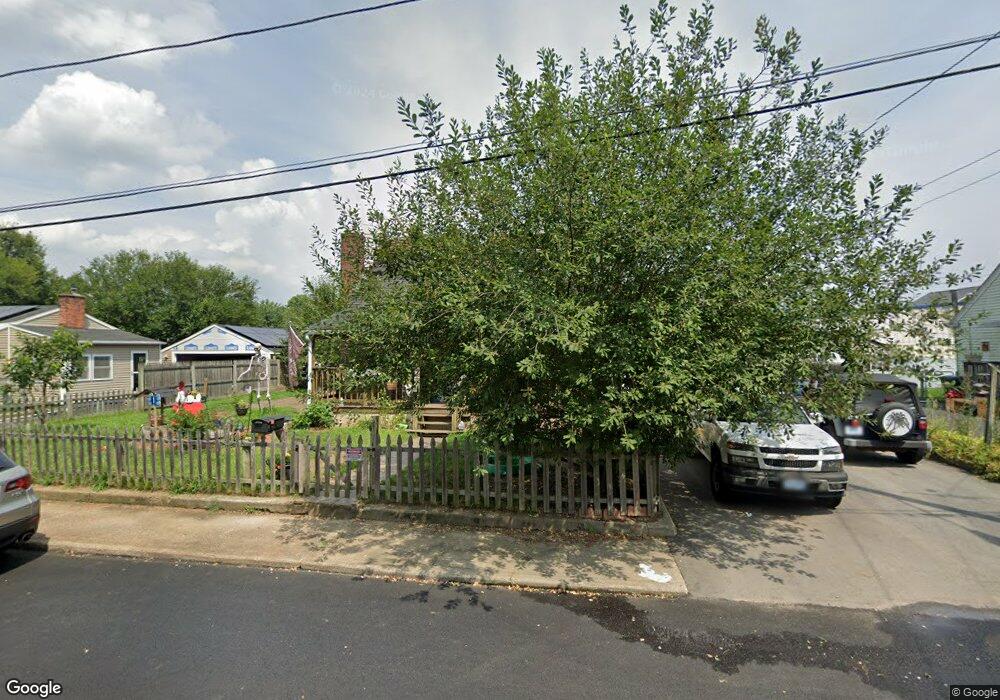
9 Whitman St Coventry, RI 02816
Estimated Value: $381,000 - $396,000
3
Beds
2
Baths
1,383
Sq Ft
$279/Sq Ft
Est. Value
About This Home
This home is located at 9 Whitman St, Coventry, RI 02816 and is currently estimated at $385,798, approximately $278 per square foot. 9 Whitman St is a home located in Kent County with nearby schools including Alan Shawn Feinstein Ms Of Cov, Coventry High School, and Father John V. Doyle School.
Ownership History
Date
Name
Owned For
Owner Type
Purchase Details
Closed on
Aug 19, 1997
Sold by
Snyder William F and Snyder Teresa
Bought by
Cafaro Steven and Cafaro Nancy
Current Estimated Value
Home Financials for this Owner
Home Financials are based on the most recent Mortgage that was taken out on this home.
Original Mortgage
$74,350
Interest Rate
7.56%
Create a Home Valuation Report for This Property
The Home Valuation Report is an in-depth analysis detailing your home's value as well as a comparison with similar homes in the area
Purchase History
| Date | Buyer | Sale Price | Title Company |
|---|---|---|---|
| Cafaro Steven | $75,000 | -- |
Source: Public Records
Mortgage History
| Date | Status | Borrower | Loan Amount |
|---|---|---|---|
| Open | Cafaro Steven | $100,000 | |
| Closed | Cafaro Steven | $95,000 | |
| Closed | Cafaro Steven | $74,350 |
Source: Public Records
Tax History
| Year | Tax Paid | Tax Assessment Tax Assessment Total Assessment is a certain percentage of the fair market value that is determined by local assessors to be the total taxable value of land and additions on the property. | Land | Improvement |
|---|---|---|---|---|
| 2025 | $4,476 | $278,200 | $78,600 | $199,600 |
| 2024 | $4,407 | $278,200 | $78,600 | $199,600 |
| 2023 | $4,265 | $278,200 | $78,600 | $199,600 |
| 2022 | $4,008 | $204,800 | $69,400 | $135,400 |
| 2021 | $3,973 | $204,800 | $69,400 | $135,400 |
| 2020 | $4,555 | $204,800 | $69,400 | $135,400 |
| 2019 | $3,585 | $161,200 | $51,600 | $109,600 |
| 2018 | $3,484 | $161,200 | $51,600 | $109,600 |
| 2017 | $3,382 | $161,200 | $51,600 | $109,600 |
| 2016 | $3,212 | $150,000 | $42,900 | $107,100 |
| 2015 | $3,125 | $150,000 | $42,900 | $107,100 |
| 2014 | $3,059 | $150,000 | $42,900 | $107,100 |
| 2013 | $2,721 | $145,800 | $41,500 | $104,300 |
Source: Public Records
Map
Nearby Homes
- 22 Colorado St
- 82 Wood St
- 45 Pine Ave Unit 36
- 57 Twin Lakes Ave
- 140 S Main St
- 10 Colonial Rd
- 18 S Main St
- 37 Holden St
- 33-35 Holden St
- 33 Holden St Unit 35
- 252 S Main St
- 21 Darton St
- 1205 Main St
- 9 Jurczyk Ct
- 17 Jurczyk Ct
- 69 Station St
- 4 Pearl St
- 39 Mohawk St
- 166 Hopkins Hill Rd
- 173 Hopkins Hill Rd
Your Personal Tour Guide
Ask me questions while you tour the home.