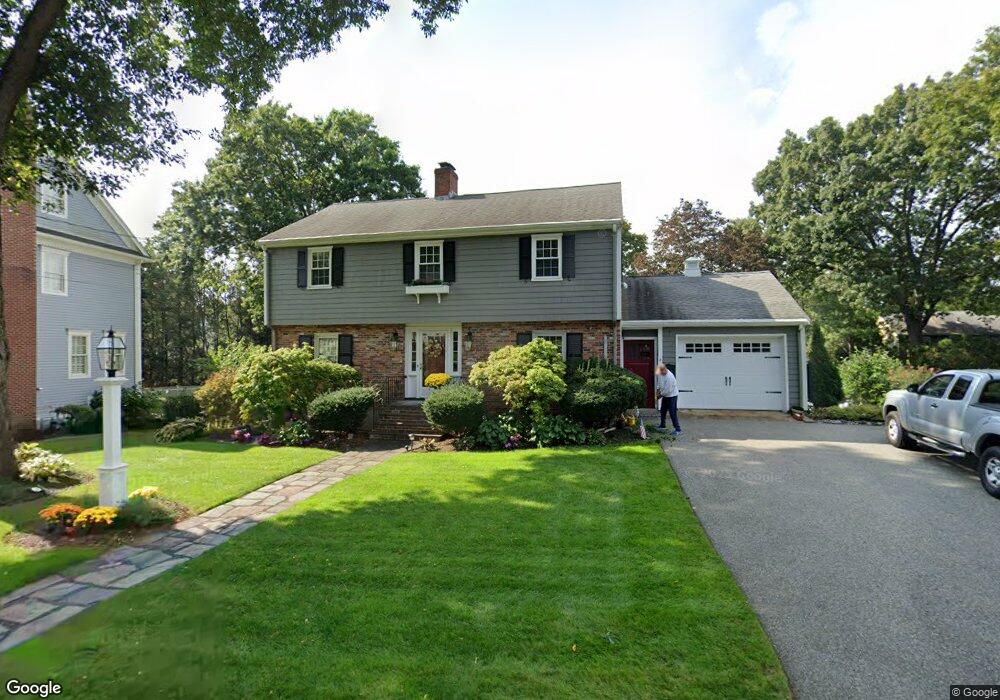
9 Wickham Rd Winchester, MA 01890
Grove Street NeighborhoodEstimated Value: $1,424,000 - $1,800,000
3
Beds
3
Baths
2,544
Sq Ft
$636/Sq Ft
Est. Value
About This Home
This home is located at 9 Wickham Rd, Winchester, MA 01890 and is currently estimated at $1,617,039, approximately $635 per square foot. 9 Wickham Rd is a home located in Middlesex County with nearby schools including Ambrose Elementary School, McCall Middle School, and Winchester High School.
Ownership History
Date
Name
Owned For
Owner Type
Purchase Details
Closed on
Feb 2, 2023
Sold by
Lattanzi Susan M and Lattanzi Gino
Bought by
Gino Lattanzi Lt
Current Estimated Value
Purchase Details
Closed on
Nov 29, 1994
Sold by
Deberardinis Eugene J and Deberardinis Gilda
Bought by
Lattanzi Gino and Lattanzi Susan M
Create a Home Valuation Report for This Property
The Home Valuation Report is an in-depth analysis detailing your home's value as well as a comparison with similar homes in the area
Home Values in the Area
Average Home Value in this Area
Purchase History
| Date | Buyer | Sale Price | Title Company |
|---|---|---|---|
| Gino Lattanzi Lt | -- | None Available | |
| Lattanzi Gino | $355,000 | -- |
Source: Public Records
Mortgage History
| Date | Status | Borrower | Loan Amount |
|---|---|---|---|
| Previous Owner | Lattanzi Gino | $276,500 | |
| Previous Owner | Lattanzi Gino | $100,000 | |
| Previous Owner | Lattanzi Gino | $100,000 |
Source: Public Records
Tax History
| Year | Tax Paid | Tax Assessment Tax Assessment Total Assessment is a certain percentage of the fair market value that is determined by local assessors to be the total taxable value of land and additions on the property. | Land | Improvement |
|---|---|---|---|---|
| 2025 | $146 | $1,316,200 | $828,100 | $488,100 |
| 2024 | $14,493 | $1,279,200 | $828,100 | $451,100 |
| 2023 | $13,787 | $1,168,400 | $728,700 | $439,700 |
| 2022 | $13,495 | $1,078,700 | $662,500 | $416,200 |
| 2021 | $12,989 | $1,012,400 | $596,200 | $416,200 |
| 2020 | $7,860 | $1,006,100 | $596,200 | $409,900 |
| 2019 | $11,382 | $939,900 | $530,000 | $409,900 |
| 2018 | $7,368 | $876,600 | $478,600 | $398,000 |
| 2017 | $9,650 | $785,800 | $411,600 | $374,200 |
| 2016 | $8,758 | $749,800 | $387,500 | $362,300 |
| 2015 | $8,930 | $735,600 | $387,500 | $348,100 |
| 2014 | $8,389 | $662,600 | $323,000 | $339,600 |
Source: Public Records
Map
Nearby Homes
- 61 Grove St
- 2 Canterbury Rd
- 20 Grove Place
- 1 Town Way
- 6 Marchant Rd
- 9 Lakeview Terrace
- 19 Town Way
- 45 Bacon St
- 17 Cranston Rd
- 39 Town Way
- 53 Winford Way
- 27 Everett Ave
- 10 Sheffield W
- 25 Myopia Rd
- 545 Winthrop St Unit Lot 6
- 545 Winthrop St Unit Lot 8
- 545 Winthrop St Unit Lot 7
- 40 Century St
- 12 Yale St
- 15 College Ave
Your Personal Tour Guide
Ask me questions while you tour the home.