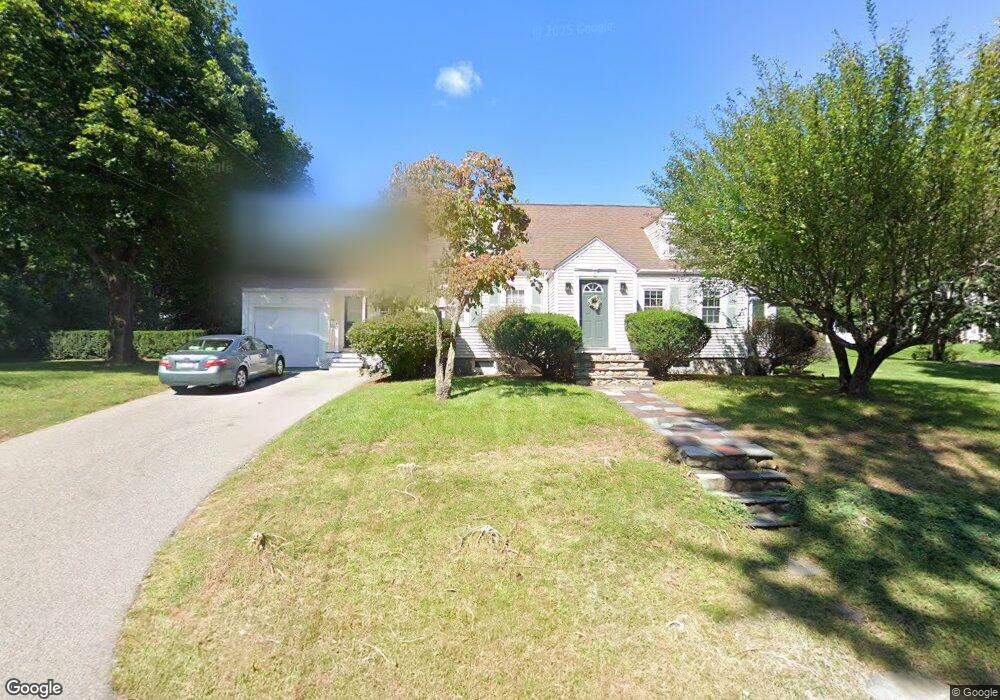
9 Wicklow Dr Westwood, MA 02090
Estimated Value: $937,999 - $1,146,000
3
Beds
2
Baths
1,744
Sq Ft
$585/Sq Ft
Est. Value
About This Home
This home is located at 9 Wicklow Dr, Westwood, MA 02090 and is currently estimated at $1,020,500, approximately $585 per square foot. 9 Wicklow Dr is a home located in Norfolk County with nearby schools including Westwood High School, St Catherine Of Siena School, and Xaverian Brothers High School.
Ownership History
Date
Name
Owned For
Owner Type
Purchase Details
Closed on
Jul 27, 2001
Sold by
Shworak Nicholas W and Shworak Una M
Bought by
Odwyer Colin S
Current Estimated Value
Purchase Details
Closed on
Sep 1, 1998
Sold by
Geraghty Anne C
Bought by
Shworak Nicholas W and Shworak Una M
Purchase Details
Closed on
Oct 30, 1989
Sold by
Murphy Susan H
Bought by
Geraghty Anne C
Create a Home Valuation Report for This Property
The Home Valuation Report is an in-depth analysis detailing your home's value as well as a comparison with similar homes in the area
Home Values in the Area
Average Home Value in this Area
Purchase History
| Date | Buyer | Sale Price | Title Company |
|---|---|---|---|
| Odwyer Colin S | $410,000 | -- | |
| Shworak Nicholas W | $304,500 | -- | |
| Geraghty Anne C | $242,000 | -- |
Source: Public Records
Mortgage History
| Date | Status | Borrower | Loan Amount |
|---|---|---|---|
| Open | Geraghty Anne C | $75,750 | |
| Open | Geraghty Anne C | $405,750 |
Source: Public Records
Tax History Compared to Growth
Tax History
| Year | Tax Paid | Tax Assessment Tax Assessment Total Assessment is a certain percentage of the fair market value that is determined by local assessors to be the total taxable value of land and additions on the property. | Land | Improvement |
|---|---|---|---|---|
| 2025 | $10,673 | $833,800 | $445,800 | $388,000 |
| 2024 | $10,208 | $796,900 | $424,500 | $372,400 |
| 2023 | $9,048 | $632,700 | $353,900 | $278,800 |
| 2022 | $8,773 | $591,600 | $312,750 | $278,850 |
| 2021 | $9,008 | $609,500 | $297,900 | $311,600 |
| 2020 | $8,444 | $581,950 | $297,900 | $284,050 |
| 2019 | $8,204 | $560,000 | $283,650 | $276,350 |
| 2018 | $7,765 | $514,600 | $283,650 | $230,950 |
| 2017 | $7,525 | $516,500 | $283,650 | $232,850 |
| 2016 | $7,411 | $505,500 | $283,650 | $221,850 |
| 2015 | $6,898 | $452,600 | $283,650 | $168,950 |
Source: Public Records
Map
Nearby Homes