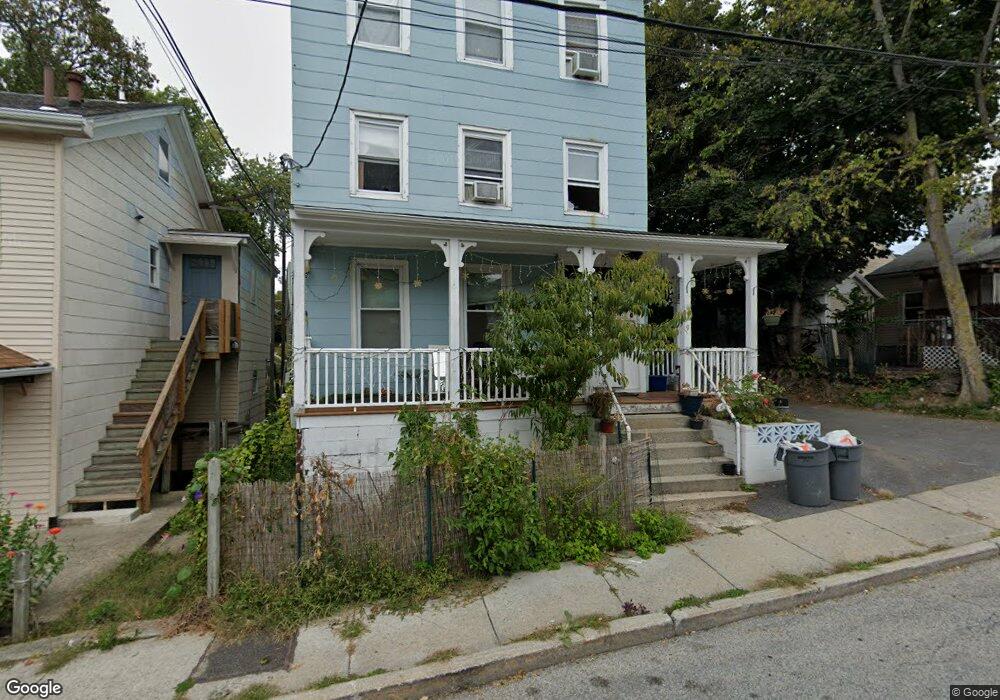
9 William St Ossining, NY 10562
Estimated Value: $557,000 - $899,000
7
Beds
3
Baths
2,772
Sq Ft
$251/Sq Ft
Est. Value
About This Home
This home is located at 9 William St, Ossining, NY 10562 and is currently estimated at $694,504, approximately $250 per square foot. 9 William St is a home located in Westchester County with nearby schools including Park School, Claremont School, and Roosevelt Elementary School.
Ownership History
Date
Name
Owned For
Owner Type
Purchase Details
Closed on
Oct 31, 2006
Sold by
Chuchuca Luis and Chuchuca Maria
Bought by
Chuchuca Manuel J
Current Estimated Value
Home Financials for this Owner
Home Financials are based on the most recent Mortgage that was taken out on this home.
Original Mortgage
$165,000
Interest Rate
7.37%
Mortgage Type
Unknown
Purchase Details
Closed on
Aug 28, 2001
Sold by
Lansky Bart
Bought by
Chuchuca Luis and Chuchuca Maria
Home Financials for this Owner
Home Financials are based on the most recent Mortgage that was taken out on this home.
Original Mortgage
$186,750
Interest Rate
6.61%
Mortgage Type
Unknown
Purchase Details
Closed on
Jun 23, 1997
Sold by
Emc Mtg Corp
Bought by
Lansky Bart
Purchase Details
Closed on
Oct 20, 1995
Sold by
The Prudential Home Mtg Company Inc
Bought by
Emc Mtg Corp
Create a Home Valuation Report for This Property
The Home Valuation Report is an in-depth analysis detailing your home's value as well as a comparison with similar homes in the area
Home Values in the Area
Average Home Value in this Area
Purchase History
| Date | Buyer | Sale Price | Title Company |
|---|---|---|---|
| Chuchuca Manuel J | $220,000 | Access Title Ins Agency Inc | |
| Chuchuca Luis | $249,000 | The Judicial Title Ins Agenc | |
| Lansky Bart | $78,000 | Commonwealth Land Title Ins | |
| Emc Mtg Corp | $106,545 | First American Title Ins Co |
Source: Public Records
Mortgage History
| Date | Status | Borrower | Loan Amount |
|---|---|---|---|
| Previous Owner | Chuchuca Manuel J | $165,000 | |
| Previous Owner | Chuchuca Luis | $186,750 |
Source: Public Records
Tax History
| Year | Tax Paid | Tax Assessment Tax Assessment Total Assessment is a certain percentage of the fair market value that is determined by local assessors to be the total taxable value of land and additions on the property. | Land | Improvement |
|---|---|---|---|---|
| 2024 | $11,571 | $413,400 | $109,100 | $304,300 |
| 2023 | $10,793 | $385,000 | $109,100 | $275,900 |
| 2022 | $9,615 | $343,500 | $109,100 | $234,400 |
| 2021 | $7,776 | $286,600 | $109,100 | $177,500 |
| 2020 | $8,655 | $275,000 | $109,100 | $165,900 |
| 2019 | $8,451 | $253,400 | $94,900 | $158,500 |
| 2018 | $8,029 | $251,000 | $94,900 | $156,100 |
| 2017 | $4,125 | $241,300 | $94,900 | $146,400 |
| 2016 | $74,672 | $241,300 | $94,900 | $146,400 |
| 2015 | $6,478 | $15,000 | $2,700 | $12,300 |
| 2014 | $6,478 | $15,000 | $2,700 | $12,300 |
| 2013 | $6,478 | $15,000 | $2,700 | $12,300 |
Source: Public Records
Map
Nearby Homes
- 131 Spring St
- 139 Spring St
- 25 William St
- 30 Hunter St
- 1 Edward St
- 39 Washington Ave
- 16 Maple Place
- 22 Lafayette Ave
- 135 Main St Unit 203
- 117 S Highland Ave Unit L2
- 128 S Highland Ave
- 121 S Highland Ave Unit 5F
- 121 S Highland Ave Unit 6L
- 121 S Highland Ave Unit 6K
- 1 Agate Ave
- 88 Broadway Unit PH1
- 312A Spring St
- 123 S Highland Ave Unit B3
- 129 S Highland Ave Unit 6A
- 94 Meadow Rd
Your Personal Tour Guide
Ask me questions while you tour the home.