9 Willow St Holyoke, MA 01040
Estimated Value: $220,000 - $323,000
3
Beds
1
Bath
1,648
Sq Ft
$164/Sq Ft
Est. Value
About This Home
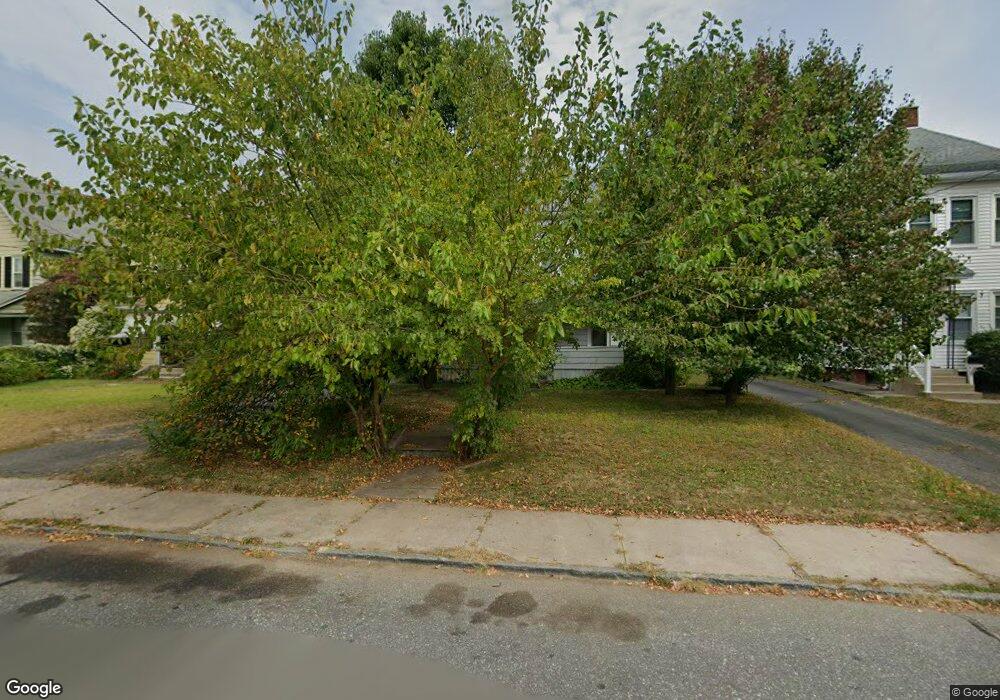
This home is located at 9 Willow St, Holyoke, MA 01040 and is currently estimated at $270,168, approximately $163 per square foot. 9 Willow St is a home located in Hampden County with nearby schools including Maurice A. Donahue Elementary School, Holyoke High School, and Holyoke Community Charter School.
Ownership History
Date
Name
Owned For
Owner Type
Purchase Details
Closed on
May 21, 2010
Sold by
Hsbc Bank Usa
Bought by
Setka Robert P
Current Estimated Value
Purchase Details
Closed on
Mar 11, 2010
Sold by
Colon Lillian and Colon Antonio
Bought by
Hsbc Bank Usa
Purchase Details
Closed on
Oct 30, 2006
Sold by
Prych Constance M
Bought by
Colon Antonio and Colon Lillian
Home Financials for this Owner
Home Financials are based on the most recent Mortgage that was taken out on this home.
Original Mortgage
$109,600
Interest Rate
6.48%
Mortgage Type
Purchase Money Mortgage
Create a Home Valuation Report for This Property
The Home Valuation Report is an in-depth analysis detailing your home's value as well as a comparison with similar homes in the area
Home Values in the Area
Average Home Value in this Area
Purchase History
| Date | Buyer | Sale Price | Title Company |
|---|---|---|---|
| Setka Robert P | $75,000 | -- | |
| Hsbc Bank Usa | $125,375 | -- | |
| Colon Antonio | $137,000 | -- |
Source: Public Records
Mortgage History
| Date | Status | Borrower | Loan Amount |
|---|---|---|---|
| Previous Owner | Colon Antonio | $109,600 | |
| Previous Owner | Colon Antonio | $27,400 |
Source: Public Records
Tax History Compared to Growth
Tax History
| Year | Tax Paid | Tax Assessment Tax Assessment Total Assessment is a certain percentage of the fair market value that is determined by local assessors to be the total taxable value of land and additions on the property. | Land | Improvement |
|---|---|---|---|---|
| 2025 | $3,850 | $220,500 | $42,400 | $178,100 |
| 2024 | $3,530 | $186,300 | $40,200 | $146,100 |
| 2023 | $3,375 | $179,900 | $40,200 | $139,700 |
| 2022 | $3,249 | $168,700 | $40,200 | $128,500 |
| 2021 | $3,063 | $158,100 | $36,500 | $121,600 |
| 2020 | $2,883 | $151,100 | $36,500 | $114,600 |
| 2019 | $2,691 | $139,500 | $31,200 | $108,300 |
| 2018 | $1,812 | $133,900 | $31,200 | $102,700 |
| 2017 | $2,567 | $133,900 | $31,200 | $102,700 |
| 2016 | $2,512 | $131,400 | $31,200 | $100,200 |
| 2015 | $2,511 | $131,900 | $31,200 | $100,700 |
Source: Public Records
Map
Nearby Homes