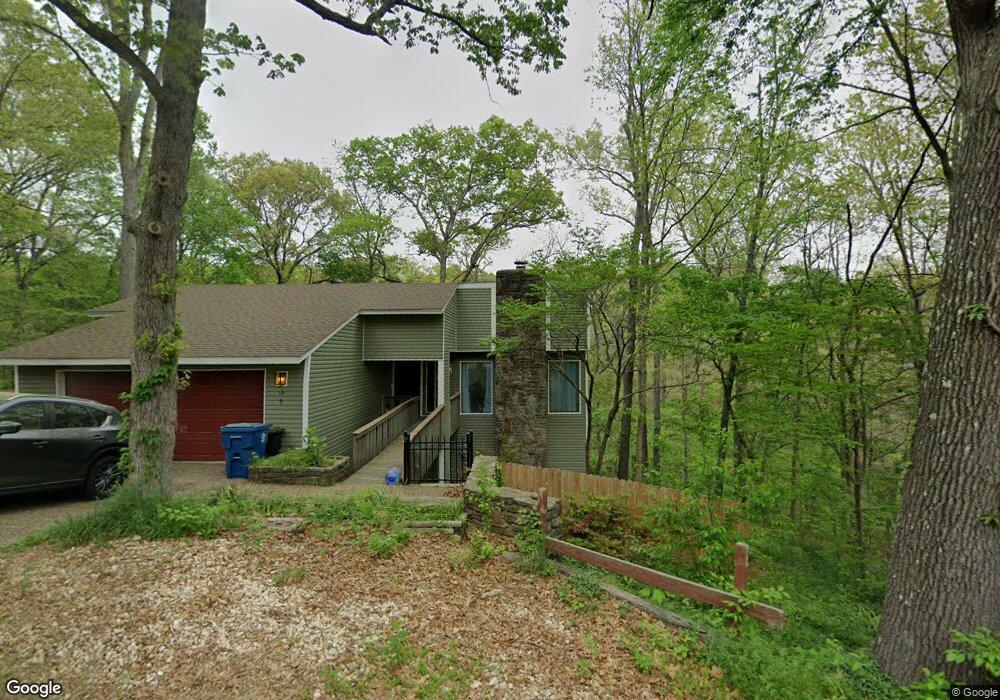
9 Wootton Dr Bella Vista, AR 72715
Estimated Value: $268,000 - $313,917
3
Beds
2
Baths
1,900
Sq Ft
$154/Sq Ft
Est. Value
About This Home
This home is located at 9 Wootton Dr, Bella Vista, AR 72715 and is currently estimated at $292,479, approximately $153 per square foot. 9 Wootton Dr is a home located in Benton County with nearby schools including Cooper Elementary School, Old High Middle School, and Washington Junior High School.
Ownership History
Date
Name
Owned For
Owner Type
Purchase Details
Closed on
May 13, 2011
Sold by
Botts Linda Diane
Bought by
Galle Frank E
Current Estimated Value
Home Financials for this Owner
Home Financials are based on the most recent Mortgage that was taken out on this home.
Original Mortgage
$82,845
Outstanding Balance
$57,227
Interest Rate
4.75%
Mortgage Type
FHA
Estimated Equity
$235,252
Purchase Details
Closed on
May 24, 2005
Sold by
Ball Oscar A and Ball Helen I
Bought by
Botts Linda Diane
Home Financials for this Owner
Home Financials are based on the most recent Mortgage that was taken out on this home.
Original Mortgage
$83,920
Interest Rate
4.37%
Mortgage Type
Adjustable Rate Mortgage/ARM
Purchase Details
Closed on
Aug 29, 2002
Bought by
Ball
Purchase Details
Closed on
Sep 16, 1994
Bought by
Ball Rev Liv Tr
Purchase Details
Closed on
Aug 20, 1981
Bought by
Mccamly Trust
Create a Home Valuation Report for This Property
The Home Valuation Report is an in-depth analysis detailing your home's value as well as a comparison with similar homes in the area
Home Values in the Area
Average Home Value in this Area
Purchase History
| Date | Buyer | Sale Price | Title Company |
|---|---|---|---|
| Galle Frank E | $85,000 | Elite Title Company Inc | |
| Botts Linda Diane | $105,000 | None Available | |
| Ball | -- | -- | |
| Ball Rev Liv Tr | $79,000 | -- | |
| Mccamly Trust | -- | -- | |
| Mccamly Tr | -- | -- |
Source: Public Records
Mortgage History
| Date | Status | Borrower | Loan Amount |
|---|---|---|---|
| Open | Galle Frank E | $82,845 | |
| Previous Owner | Botts Linda Diane | $83,920 |
Source: Public Records
Tax History Compared to Growth
Tax History
| Year | Tax Paid | Tax Assessment Tax Assessment Total Assessment is a certain percentage of the fair market value that is determined by local assessors to be the total taxable value of land and additions on the property. | Land | Improvement |
|---|---|---|---|---|
| 2025 | $1,688 | $56,857 | $1,600 | $55,257 |
| 2024 | $1,595 | $56,857 | $1,600 | $55,257 |
| 2023 | $1,519 | $37,620 | $800 | $36,820 |
| 2022 | $1,125 | $37,620 | $800 | $36,820 |
| 2021 | $1,053 | $37,620 | $800 | $36,820 |
| 2020 | $997 | $24,770 | $600 | $24,170 |
| 2019 | $942 | $24,770 | $600 | $24,170 |
| 2018 | $913 | $24,770 | $600 | $24,170 |
| 2017 | $760 | $24,770 | $600 | $24,170 |
| 2016 | $760 | $24,770 | $600 | $24,170 |
| 2015 | $1,037 | $17,200 | $1,000 | $16,200 |
| 2014 | $687 | $17,200 | $1,000 | $16,200 |
Source: Public Records
Map
Nearby Homes
- 3235 Wootton Dr
- - Wootton Dr
- L7 Wootton Dr
- -- Wootton Dr
- 0 Wootton Dr Unit 445038
- 0 Wootton Dr Unit 471845
- 0 Wootton Dr Unit Lot 9 1267045
- 0 Wootton (Lot 3) Dr Unit 1035745
- 0 Wootton Dr
- 10 Wootton Dr
- 6 Wootton Dr
- 2507 Bradford Dr
- 1011 Bradford Dr
- 9025 Bradford Dr
- 115 Bradford Dr
- 4 Wootton Dr
- 3424 Bradford Dr
- 30 Chapel Ln
- 19 Wootton Dr
- 23 Wootton Dr