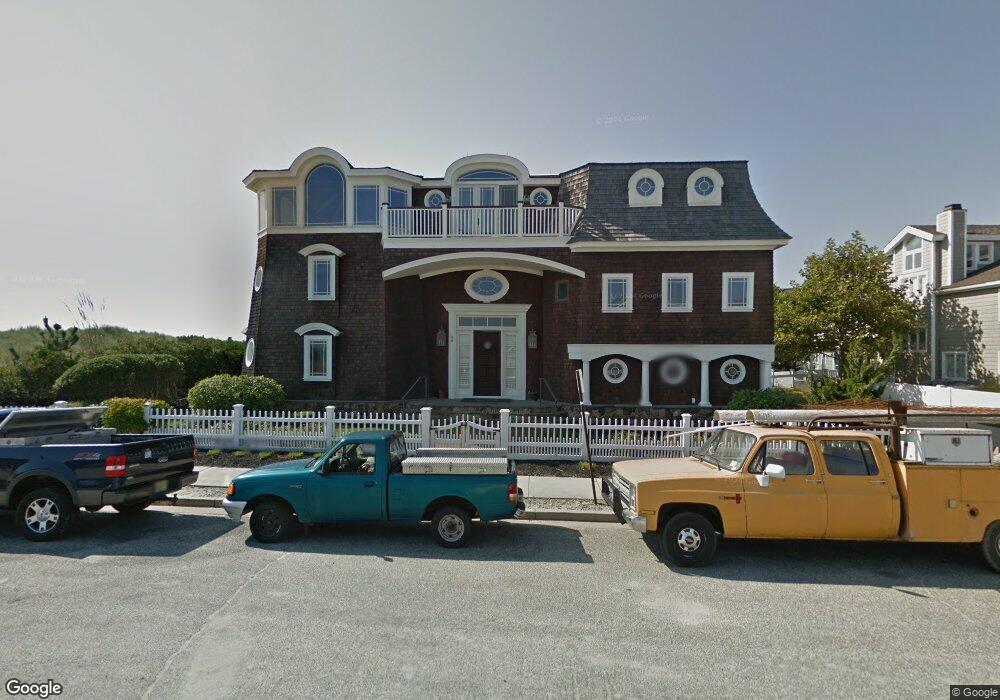
90 10th St E Avalon, NJ 08202
Estimated Value: $4,740,000 - $10,873,677
Studio
--
Bath
7,241
Sq Ft
$1,081/Sq Ft
Est. Value
About This Home
This home is located at 90 10th St E, Avalon, NJ 08202 and is currently estimated at $7,829,226, approximately $1,081 per square foot. 90 10th St E is a home located in Cape May County with nearby schools including Avalon Elementary School.
Ownership History
Date
Name
Owned For
Owner Type
Purchase Details
Closed on
Dec 23, 2020
Sold by
Hagan Michael J and Hagan Joyce L
Bought by
Qprt New Jersey
Current Estimated Value
Purchase Details
Closed on
Dec 6, 2000
Sold by
Srein Ronald
Bought by
Hagan Michael J and Hagan Joyce L
Purchase Details
Closed on
Apr 10, 1999
Sold by
Srein Ronald
Bought by
Hagan Michael and Hagan Joyce
Home Financials for this Owner
Home Financials are based on the most recent Mortgage that was taken out on this home.
Original Mortgage
$240,000
Interest Rate
6.83%
Purchase Details
Closed on
Oct 26, 1990
Sold by
Crans Russell K and Crans Virginia R
Bought by
Spein Ronald
Create a Home Valuation Report for This Property
The Home Valuation Report is an in-depth analysis detailing your home's value as well as a comparison with similar homes in the area
Home Values in the Area
Average Home Value in this Area
Purchase History
| Date | Buyer | Sale Price | Title Company |
|---|---|---|---|
| Qprt New Jersey | -- | None Available | |
| Hagan Michael J | $3,180,000 | -- | |
| Hagan Michael | $890,000 | -- | |
| Spein Ronald | $1,065,000 | -- |
Source: Public Records
Mortgage History
| Date | Status | Borrower | Loan Amount |
|---|---|---|---|
| Previous Owner | Hagan Michael | $240,000 |
Source: Public Records
Tax History
| Year | Tax Paid | Tax Assessment Tax Assessment Total Assessment is a certain percentage of the fair market value that is determined by local assessors to be the total taxable value of land and additions on the property. | Land | Improvement |
|---|---|---|---|---|
| 2025 | $59,136 | $9,631,200 | $6,750,000 | $2,881,200 |
| 2024 | $59,136 | $9,631,200 | $6,750,000 | $2,881,200 |
| 2023 | $58,654 | $9,631,200 | $6,750,000 | $2,881,200 |
| 2022 | $54,705 | $9,631,200 | $6,750,000 | $2,881,200 |
| 2021 | $39,852 | $9,631,200 | $6,750,000 | $2,881,200 |
| 2020 | $50,660 | $9,631,200 | $6,750,000 | $2,881,200 |
| 2019 | $49,119 | $9,631,200 | $6,750,000 | $2,881,200 |
| 2018 | $47,000 | $9,631,200 | $6,750,000 | $2,881,200 |
| 2017 | $38,878 | $6,992,400 | $3,850,000 | $3,142,400 |
| 2016 | $38,458 | $6,992,400 | $3,850,000 | $3,142,400 |
| 2015 | $37,829 | $6,992,400 | $3,850,000 | $3,142,400 |
| 2014 | $37,409 | $6,992,400 | $3,850,000 | $3,142,400 |
Source: Public Records
Map
Nearby Homes
Your Personal Tour Guide
Ask me questions while you tour the home.