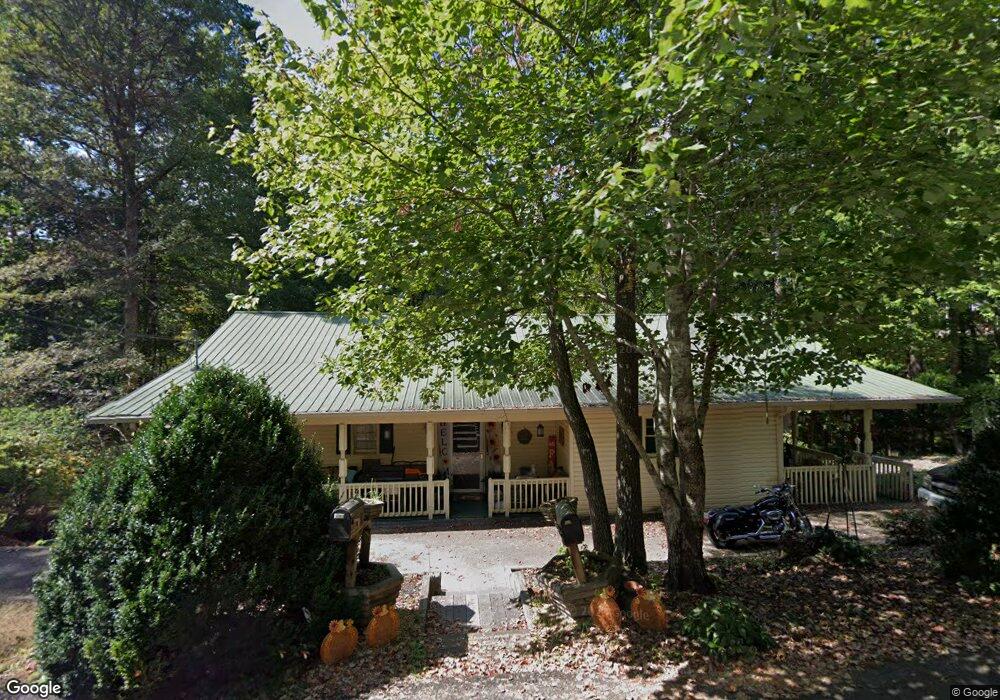
90 Azalea Trail Dahlonega, GA 30533
Estimated Value: $294,955 - $548,000
--
Bed
3
Baths
3,536
Sq Ft
$120/Sq Ft
Est. Value
About This Home
This home is located at 90 Azalea Trail, Dahlonega, GA 30533 and is currently estimated at $422,739, approximately $119 per square foot. 90 Azalea Trail is a home located in Lumpkin County with nearby schools including Clay County Middle School and Lumpkin County High School.
Ownership History
Date
Name
Owned For
Owner Type
Purchase Details
Closed on
May 20, 2021
Sold by
Executor Gilstrap Brenda Lucille
Bought by
Goodman Joshua I
Current Estimated Value
Home Financials for this Owner
Home Financials are based on the most recent Mortgage that was taken out on this home.
Original Mortgage
$110,000
Outstanding Balance
$99,374
Interest Rate
2.9%
Mortgage Type
New Conventional
Estimated Equity
$323,365
Purchase Details
Closed on
Apr 20, 2010
Sold by
Norrell Robert David
Bought by
Norrell Mildred Reeves
Purchase Details
Closed on
Sep 24, 1991
Sold by
Bank Of Dahlonega
Bought by
Norrell Jewell
Purchase Details
Closed on
Aug 6, 1991
Sold by
Thompson James Lee
Bought by
Bank Of Dahlonega
Purchase Details
Closed on
Oct 7, 1988
Sold by
Thompson Nancy Jo
Bought by
Thompson James Lee
Purchase Details
Closed on
May 1, 1986
Sold by
Thompson James Lee
Bought by
Thompson Nancy Jo
Purchase Details
Closed on
Dec 1, 1984
Bought by
Thompson James Lee
Create a Home Valuation Report for This Property
The Home Valuation Report is an in-depth analysis detailing your home's value as well as a comparison with similar homes in the area
Home Values in the Area
Average Home Value in this Area
Purchase History
| Date | Buyer | Sale Price | Title Company |
|---|---|---|---|
| Goodman Joshua I | $180,000 | -- | |
| Norrell Mildred Reeves | -- | -- | |
| Norrell Jewell | $33,500 | -- | |
| Bank Of Dahlonega | $34,300 | -- | |
| Thompson James Lee | -- | -- | |
| Thompson Nancy Jo | -- | -- | |
| Thompson James Lee | -- | -- |
Source: Public Records
Mortgage History
| Date | Status | Borrower | Loan Amount |
|---|---|---|---|
| Open | Goodman Joshua I | $110,000 |
Source: Public Records
Tax History Compared to Growth
Tax History
| Year | Tax Paid | Tax Assessment Tax Assessment Total Assessment is a certain percentage of the fair market value that is determined by local assessors to be the total taxable value of land and additions on the property. | Land | Improvement |
|---|---|---|---|---|
| 2024 | $2,173 | $76,940 | $8,000 | $68,940 |
| 2023 | $2,118 | $73,479 | $8,000 | $65,479 |
| 2022 | $2,200 | $73,150 | $8,000 | $65,150 |
| 2021 | $2,131 | $65,324 | $8,000 | $57,324 |
| 2020 | $25 | $64,254 | $8,000 | $56,254 |
| 2019 | $25 | $64,254 | $8,000 | $56,254 |
| 2018 | $2,108 | $57,908 | $8,000 | $49,908 |
| 2017 | $0 | $59,660 | $8,000 | $51,660 |
| 2016 | $2,003 | $56,802 | $8,000 | $48,802 |
| 2015 | -- | $56,802 | $8,000 | $48,802 |
| 2014 | -- | $58,595 | $8,000 | $50,595 |
| 2013 | -- | $60,387 | $8,000 | $52,387 |
Source: Public Records
Map
Nearby Homes
- 490 Golden Ave
- 747 Golden Ave
- 567 Crown Mountain Way
- Lot 20 Crown Mountain Way
- 0 Crown Mountain Way Unit 7666031
- LOT 13 Crown Mountain Way
- Lot 28 Crown Mountain Way
- Lot 30 Crown Mountain Way
- 934 Golden Ave
- 99 Madeline Anthony Rd
- 99 Madeline Anthony Road Lots 44 and 45
- 1415 Calhoun Rd
- 0 Deer Run Unit 10437845
- 1170 Calhoun Rd
- 0 Crown Mountain Unit 7682225
- 0 Crown Mountain Unit 10644759
- 735 Calhoun Rd
- 0 Alicia Ln
- 372 Stoneybrook Dr
- 396 Stoneybrook Dr
- 0 Azalea Trail Unit 8726482
- 0 Azalea Trail Unit 7040696
- 0 Azalea Trail Unit 3114736
- 81 Trevor Trail
- 105 Azalea Trail
- 73 Azalea Trail
- 135 Azalea Trail
- 166 Azalea Trail
- 25 Trevor Trail
- 109 Azalea Trail
- lot 5 Trevor Trail
- lot 4 Trevor Trail
- 76 Trevor Trail
- Lot 15 Trevor Trail
- 15 Trevor Trail
- 466 Golden Ave
- 0 Trevor Trail Unit 7283741
- 0 Trevor Trail
- 42 Trevor Trail
- 0 Dohiyi Valley Rd