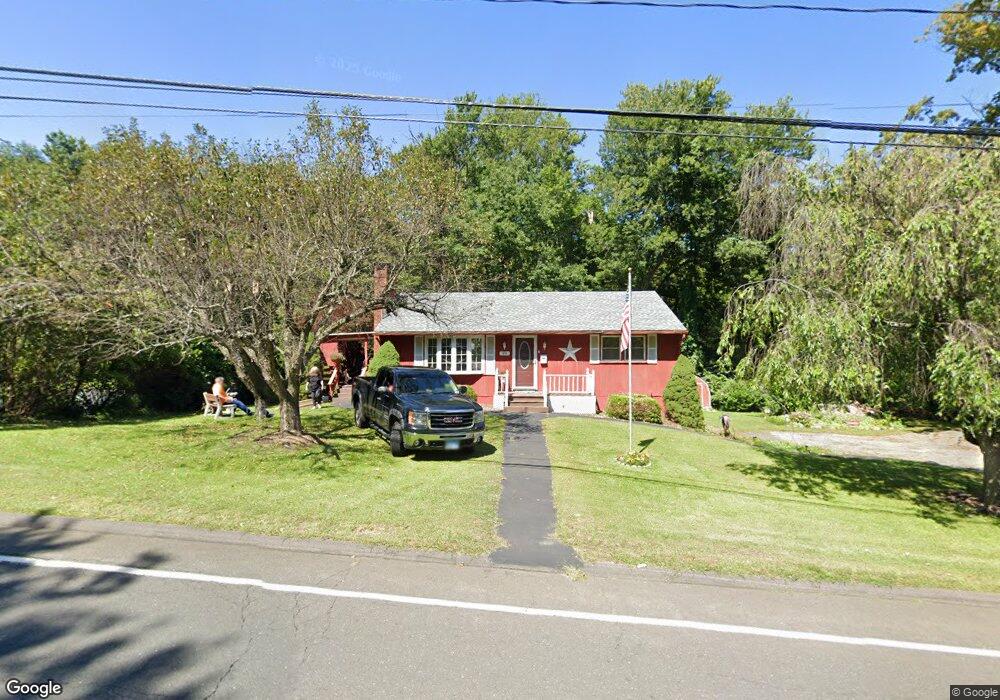
90 Boyd St Winsted, CT 06098
Estimated Value: $220,000 - $319,000
2
Beds
1
Bath
988
Sq Ft
$264/Sq Ft
Est. Value
About This Home
This home is located at 90 Boyd St, Winsted, CT 06098 and is currently estimated at $261,163, approximately $264 per square foot. 90 Boyd St is a home located in Litchfield County with nearby schools including Explorations Charter School, St Anthony School, and The Gilbert School.
Ownership History
Date
Name
Owned For
Owner Type
Purchase Details
Closed on
May 3, 2007
Sold by
Marchi Gloria J and Lacasse Linda L
Bought by
Coon Leon E and Coon Margaret T
Current Estimated Value
Home Financials for this Owner
Home Financials are based on the most recent Mortgage that was taken out on this home.
Original Mortgage
$101,800
Interest Rate
6.23%
Purchase Details
Closed on
Jul 19, 2001
Sold by
Est Godsoe John E and Godsoe John E Est Nadine J
Bought by
Marchi Gloria J and Lacasse Linda L
Create a Home Valuation Report for This Property
The Home Valuation Report is an in-depth analysis detailing your home's value as well as a comparison with similar homes in the area
Home Values in the Area
Average Home Value in this Area
Purchase History
| Date | Buyer | Sale Price | Title Company |
|---|---|---|---|
| Coon Leon E | $101,800 | -- | |
| Coon Leon E | $101,800 | -- | |
| Marchi Gloria J | $87,000 | -- | |
| Marchi Gloria J | $87,000 | -- |
Source: Public Records
Mortgage History
| Date | Status | Borrower | Loan Amount |
|---|---|---|---|
| Open | Marchi Gloria J | $110,000 | |
| Closed | Marchi Gloria J | $101,800 |
Source: Public Records
Tax History Compared to Growth
Tax History
| Year | Tax Paid | Tax Assessment Tax Assessment Total Assessment is a certain percentage of the fair market value that is determined by local assessors to be the total taxable value of land and additions on the property. | Land | Improvement |
|---|---|---|---|---|
| 2025 | $3,016 | $103,390 | $33,110 | $70,280 |
| 2024 | $2,816 | $103,390 | $33,110 | $70,280 |
| 2023 | $2,728 | $103,390 | $33,110 | $70,280 |
| 2022 | $2,784 | $83,020 | $24,080 | $58,940 |
| 2021 | $2,784 | $83,020 | $24,080 | $58,940 |
| 2020 | $2,784 | $83,020 | $24,080 | $58,940 |
| 2019 | $2,784 | $83,020 | $24,080 | $58,940 |
| 2018 | $2,784 | $83,020 | $24,080 | $58,940 |
| 2017 | $2,759 | $82,250 | $24,080 | $58,170 |
| 2016 | $2,759 | $82,250 | $24,080 | $58,170 |
| 2015 | $2,690 | $82,250 | $24,080 | $58,170 |
| 2014 | $2,625 | $82,250 | $24,080 | $58,170 |
Source: Public Records
Map
Nearby Homes