Estimated Value: $246,715 - $300,000
4
Beds
2
Baths
1,630
Sq Ft
$166/Sq Ft
Est. Value
About This Home
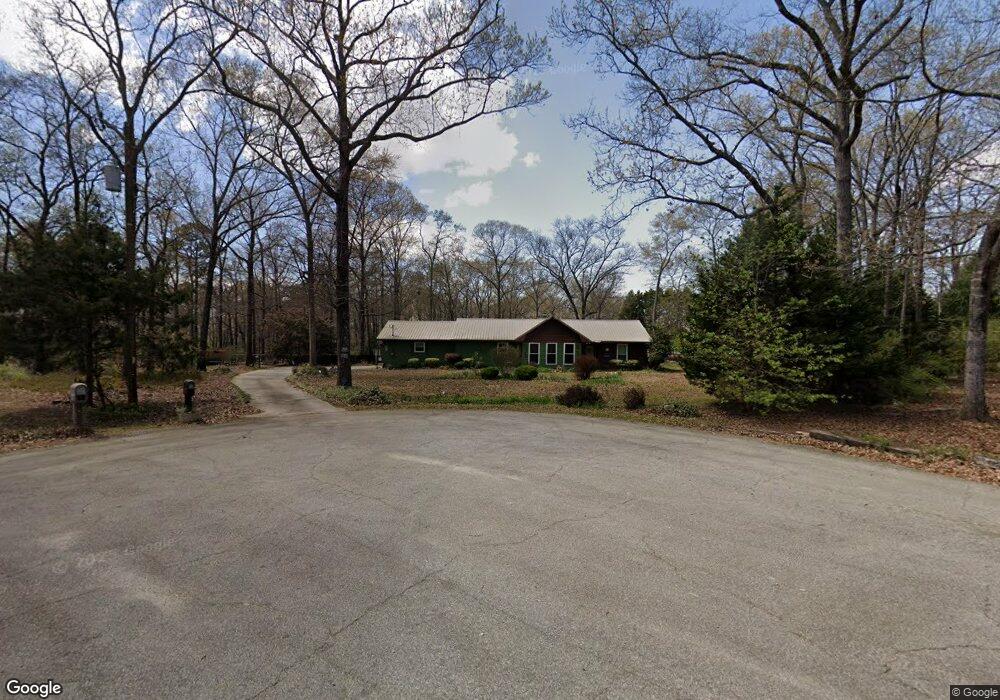
This home is located at 90 Brer Rabbit Ct, Byron, GA 31008 and is currently estimated at $270,429, approximately $165 per square foot. 90 Brer Rabbit Ct is a home located in Peach County with nearby schools including Byron Elementary School, Byron Middle School, and Peach County High School.
Ownership History
Date
Name
Owned For
Owner Type
Purchase Details
Closed on
Feb 27, 2004
Sold by
Moore Ii Robert Dale
Bought by
Moore Ii Robert Dale and Lara Holiday-
Current Estimated Value
Purchase Details
Closed on
Aug 30, 1999
Sold by
Frederick James H
Bought by
Frederick Joy Michelle
Purchase Details
Closed on
Aug 7, 1996
Bought by
Frederick James H and Joy Smith
Purchase Details
Closed on
Dec 12, 1986
Bought by
Stone Kenneth R and Stone Susan E
Purchase Details
Closed on
Jul 22, 1986
Bought by
Keener John H & Associates
Purchase Details
Closed on
Feb 29, 1984
Bought by
Parmer James E and Parmer Rebecca E
Purchase Details
Closed on
Jun 16, 1982
Bought by
Fox Valley Inc
Create a Home Valuation Report for This Property
The Home Valuation Report is an in-depth analysis detailing your home's value as well as a comparison with similar homes in the area
Home Values in the Area
Average Home Value in this Area
Purchase History
| Date | Buyer | Sale Price | Title Company |
|---|---|---|---|
| Moore Ii Robert Dale | -- | -- | |
| Moore Ii Robert Dale | $124,000 | -- | |
| Frederick Joy Michelle | -- | -- | |
| Frederick James H | $88,500 | -- | |
| Stone Kenneth R | $73,000 | -- | |
| Keener John H & Associates | $9,000 | -- | |
| Parmer James E | $10,000 | -- | |
| Fox Valley Inc | -- | -- |
Source: Public Records
Tax History
| Year | Tax Paid | Tax Assessment Tax Assessment Total Assessment is a certain percentage of the fair market value that is determined by local assessors to be the total taxable value of land and additions on the property. | Land | Improvement |
|---|---|---|---|---|
| 2025 | $1,914 | $68,064 | $15,280 | $52,784 |
| 2024 | $2,059 | $71,504 | $15,680 | $55,824 |
| 2023 | $1,812 | $61,740 | $14,000 | $47,740 |
| 2022 | $1,733 | $58,804 | $14,000 | $44,804 |
| 2021 | $1,668 | $48,892 | $12,320 | $36,572 |
| 2020 | $1,672 | $49,004 | $12,320 | $36,684 |
| 2019 | $1,679 | $49,004 | $12,320 | $36,684 |
| 2018 | $1,686 | $49,004 | $12,320 | $36,684 |
| 2017 | $1,694 | $49,004 | $12,320 | $36,684 |
| 2016 | $1,687 | $49,004 | $12,320 | $36,684 |
| 2015 | $1,773 | $51,640 | $12,320 | $39,320 |
| 2014 | $1,775 | $51,640 | $12,320 | $39,320 |
| 2013 | -- | $51,640 | $12,320 | $39,320 |
Source: Public Records
Map
Nearby Homes
- 125 Peregrine Dr
- 35 Falcon Crest Way
- 251 Peregrine Dr
- 173 Preston Rd
- Lot 5 Trojan Way
- Lot 6 Trojan Way
- 551 Felton Wood Rd
- 251 Hampton Oaks Way
- Lot 2 Trojan Way
- Lot 1 Trojan Way
- 420 Southland Trail
- 510 Southland Trail
- 538 Southland Trail
- 68 Will Way
- 244 Shantz Way
- 242 Shantz Way
- 244 Shantz Way Unit (LOT A39)
- 242 Shantz Way Unit LOT A38
- 103 June Crest Ct
- V L Hwy 42 Unit LotWP001
- 89 Brer Rabbit Ct
- 65 Brer Rabbit Ct
- 74 Brer Rabbit Ct
- 3421 Moseley Rd
- 3489 Moseley Rd
- 64 Fox Hound Dr
- 3509 Moseley Rd
- 35 Brer Rabbit Ct
- 125 Fox Hound Dr
- 185 Fox Hound Dr
- 788 Cochran Dr
- 808 Cochran Dr
- 190 Fox Hound Dr
- 3311 Moseley Rd
- 224 Fox Hound Dr
- 686 Cochran Dr
- 3565 Moseley Rd
- 230 Fox Hound Dr
- 733 Cochran Dr
- 3239 Moseley Rd
Your Personal Tour Guide
Ask me questions while you tour the home.