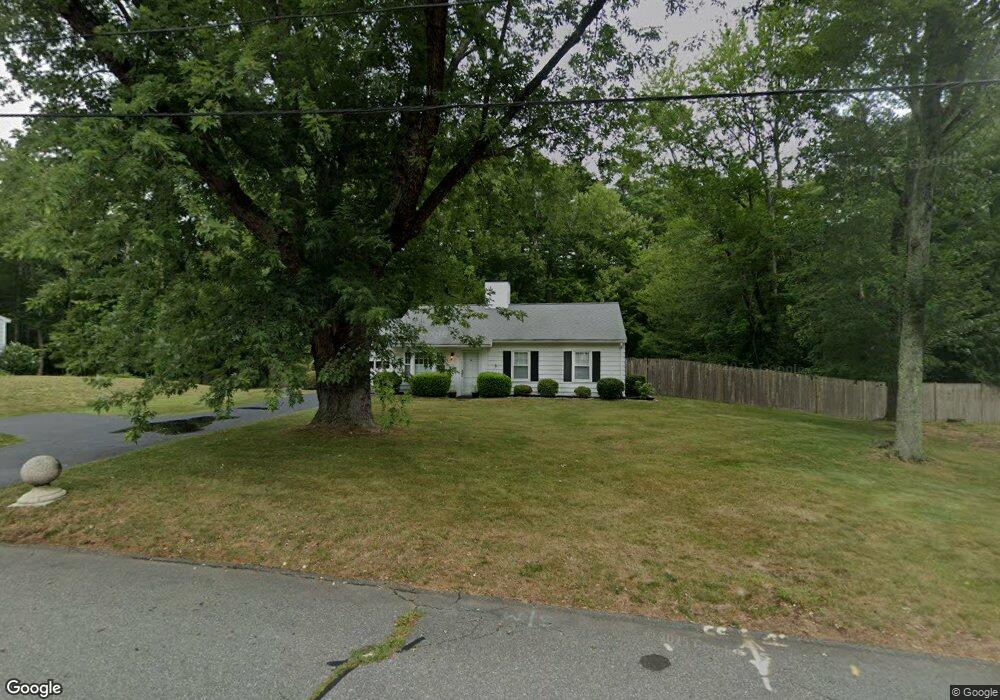
90 Brook Cir Hanover, MA 02339
Estimated Value: $547,566 - $606,000
3
Beds
1
Bath
1,428
Sq Ft
$408/Sq Ft
Est. Value
About This Home
This home is located at 90 Brook Cir, Hanover, MA 02339 and is currently estimated at $582,892, approximately $408 per square foot. 90 Brook Cir is a home located in Plymouth County with nearby schools including Hanover High School and Calvary Chapel Academy.
Ownership History
Date
Name
Owned For
Owner Type
Purchase Details
Closed on
Nov 8, 2018
Sold by
Tavares Eugene D Est and Tavares
Bought by
Carolyn A Tavares T A and Carolyn Tavares
Current Estimated Value
Purchase Details
Closed on
Nov 1, 2017
Sold by
Tavares Carolyn A and Tavares Eugene D
Bought by
Tavares Eugene D
Purchase Details
Closed on
Mar 30, 2011
Sold by
Stranger Carla and Tavares Michael
Bought by
Tavares Carolyn A and Tavares Eugene D
Purchase Details
Closed on
Jan 25, 2010
Sold by
Tavares Carolyn A and Tavares Eugene D
Bought by
Strange Carla and Tavares Michael
Create a Home Valuation Report for This Property
The Home Valuation Report is an in-depth analysis detailing your home's value as well as a comparison with similar homes in the area
Home Values in the Area
Average Home Value in this Area
Purchase History
| Date | Buyer | Sale Price | Title Company |
|---|---|---|---|
| Carolyn A Tavares T A | -- | -- | |
| Carolyn A Tavares T A | -- | -- | |
| Tavares Eugene D | -- | -- | |
| Tavares Eugene D | -- | -- | |
| Tavares Carolyn A | -- | -- | |
| Tavares Carolyn A | -- | -- | |
| Strange Carla | -- | -- | |
| Strange Carla | -- | -- |
Source: Public Records
Tax History
| Year | Tax Paid | Tax Assessment Tax Assessment Total Assessment is a certain percentage of the fair market value that is determined by local assessors to be the total taxable value of land and additions on the property. | Land | Improvement |
|---|---|---|---|---|
| 2025 | $5,543 | $448,800 | $210,800 | $238,000 |
| 2024 | $5,763 | $448,800 | $210,800 | $238,000 |
| 2023 | $5,299 | $392,800 | $191,700 | $201,100 |
| 2022 | $5,675 | $372,100 | $215,700 | $156,400 |
| 2021 | $5,508 | $337,300 | $185,200 | $152,100 |
| 2020 | $5,253 | $322,100 | $174,300 | $147,800 |
| 2019 | $4,646 | $283,100 | $152,500 | $130,600 |
| 2018 | $4,803 | $295,000 | $170,000 | $125,000 |
| 2017 | $4,553 | $275,600 | $158,900 | $116,700 |
| 2016 | $4,648 | $275,700 | $159,000 | $116,700 |
| 2015 | $4,220 | $261,300 | $159,000 | $102,300 |
Source: Public Records
Map
Nearby Homes
- 561 Circuit St
- 823 Market St
- 506 Main St
- 47 Stone Meadow Ln
- 36 Bayberry Ln
- 44 Stone Meadow Ln
- 75 School St
- 50 Village Ln
- 776 Main St
- 62 Larchmont Ln
- 9 Old Market St
- 95 Tecumseh Dr
- 73 Shingle Mill Ln
- 696 Summer St
- 36 Grove St
- 49 Liberty St
- 117 Liberty St
- 92 Liberty St
- 250 Center St
- 51 Cervelli Farm Dr
Your Personal Tour Guide
Ask me questions while you tour the home.