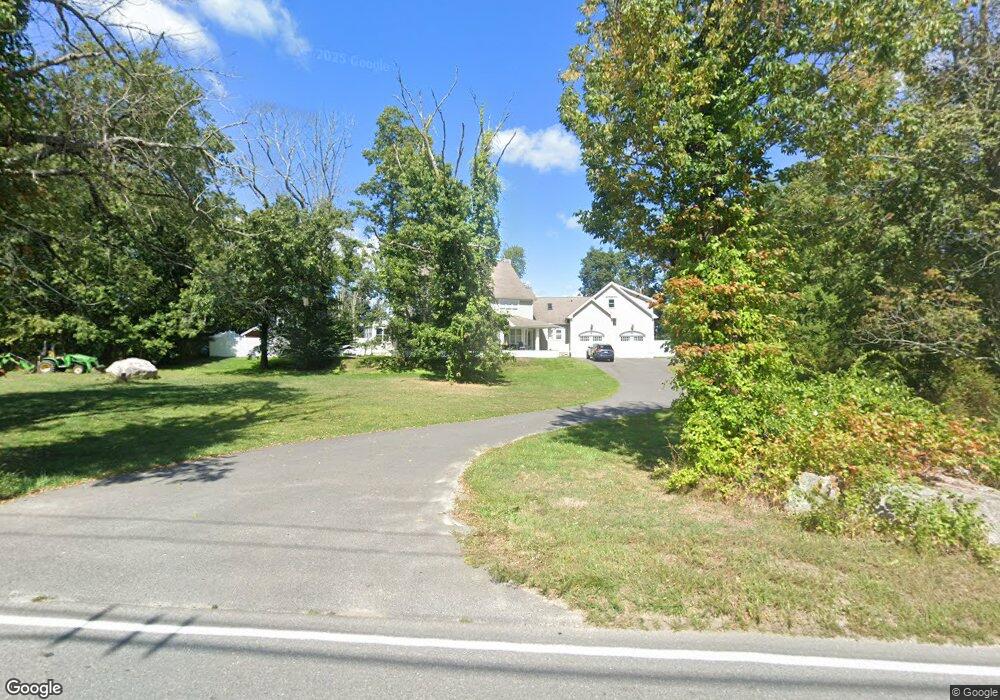
90 Chace Rd East Freetown, MA 02717
Estimated Value: $1,118,623 - $1,416,000
3
Beds
3
Baths
4,018
Sq Ft
$315/Sq Ft
Est. Value
About This Home
This home is located at 90 Chace Rd, East Freetown, MA 02717 and is currently estimated at $1,265,208, approximately $314 per square foot. 90 Chace Rd is a home located in Bristol County with nearby schools including Freetown Elementary School, George R Austin Intermediate School, and Freetown-Lakeville Middle School.
Ownership History
Date
Name
Owned For
Owner Type
Purchase Details
Closed on
Mar 16, 2009
Sold by
Bergeron Frank
Bought by
Bergeron Frank and Bergeron Elizabeth M
Current Estimated Value
Home Financials for this Owner
Home Financials are based on the most recent Mortgage that was taken out on this home.
Original Mortgage
$417,000
Interest Rate
5.18%
Mortgage Type
Purchase Money Mortgage
Purchase Details
Closed on
Sep 3, 2004
Sold by
Chace Harris H
Bought by
Bergeron Frank
Create a Home Valuation Report for This Property
The Home Valuation Report is an in-depth analysis detailing your home's value as well as a comparison with similar homes in the area
Home Values in the Area
Average Home Value in this Area
Purchase History
| Date | Buyer | Sale Price | Title Company |
|---|---|---|---|
| Bergeron Frank | -- | -- | |
| Bergeron Frank | $90,000 | -- |
Source: Public Records
Mortgage History
| Date | Status | Borrower | Loan Amount |
|---|---|---|---|
| Open | Bergeron Frank | $408,000 | |
| Closed | Bergeron Frank | $417,000 |
Source: Public Records
Tax History Compared to Growth
Tax History
| Year | Tax Paid | Tax Assessment Tax Assessment Total Assessment is a certain percentage of the fair market value that is determined by local assessors to be the total taxable value of land and additions on the property. | Land | Improvement |
|---|---|---|---|---|
| 2025 | $11,141 | $1,124,200 | $172,400 | $951,800 |
| 2024 | $11,177 | $1,071,600 | $162,700 | $908,900 |
| 2023 | $11,128 | $1,039,000 | $146,500 | $892,500 |
| 2022 | $9,520 | $789,400 | $124,100 | $665,300 |
| 2021 | $8,792 | $692,300 | $112,800 | $579,500 |
| 2020 | $8,528 | $655,000 | $108,500 | $546,500 |
| 2019 | $8,089 | $615,100 | $103,300 | $511,800 |
| 2018 | $7,860 | $590,500 | $103,300 | $487,200 |
| 2017 | $7,638 | $573,400 | $103,300 | $470,100 |
| 2016 | $7,947 | $607,100 | $100,400 | $506,700 |
| 2015 | $7,774 | $602,600 | $100,400 | $502,200 |
| 2014 | $6,905 | $547,600 | $98,300 | $449,300 |
Source: Public Records
Map
Nearby Homes
- 144 Chace Rd
- 0 Costa Dr
- 195 Slab Bridge Rd
- 24 Bells Brook Rd
- 9 Paul Ave
- 599 Quanapoag Rd
- 4597 Acushnet Ave
- 5 Freetown St
- 1475 Braley Rd Unit 17
- 150 Quanapoag Rd
- 7 Great Cedar Crossing
- Lot 2/3 Quanapoag Rd
- 13 Luscomb Ln
- 16 Swallow St
- 1069 Cherokee St
- 15 Morrison Way
- 319 Northwest St
- 269 Middleboro Rd
- 120 Hackett Ave
- 00 Island Rd