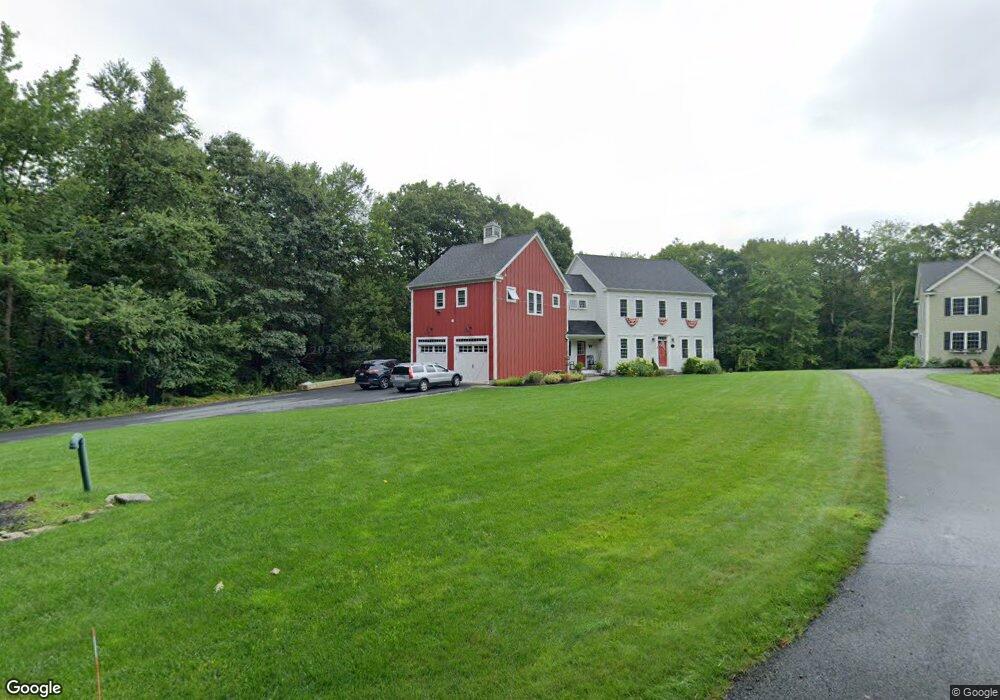
90 Chapin Rd Holden, MA 01520
Estimated Value: $898,000 - $953,664
4
Beds
4
Baths
3,076
Sq Ft
$301/Sq Ft
Est. Value
About This Home
This home is located at 90 Chapin Rd, Holden, MA 01520 and is currently estimated at $926,916, approximately $301 per square foot. 90 Chapin Rd is a home with nearby schools including Wachusett Regional High School and Holden Christian Academy.
Ownership History
Date
Name
Owned For
Owner Type
Purchase Details
Closed on
Nov 12, 2013
Sold by
Hagglund Donna J and Berry Kerry L
Bought by
Berry Jason S
Current Estimated Value
Home Financials for this Owner
Home Financials are based on the most recent Mortgage that was taken out on this home.
Original Mortgage
$393,000
Outstanding Balance
$295,586
Interest Rate
4%
Mortgage Type
Adjustable Rate Mortgage/ARM
Estimated Equity
$631,330
Purchase Details
Closed on
Jun 21, 2012
Sold by
Beckner Lorine
Bought by
Hagglund Donna J
Purchase Details
Closed on
Dec 4, 2007
Sold by
Lam Bldrs Inc
Bought by
Beckner Lorine
Create a Home Valuation Report for This Property
The Home Valuation Report is an in-depth analysis detailing your home's value as well as a comparison with similar homes in the area
Home Values in the Area
Average Home Value in this Area
Purchase History
| Date | Buyer | Sale Price | Title Company |
|---|---|---|---|
| Berry Jason S | -- | -- | |
| Hagglund Donna J | $85,000 | -- | |
| Beckner Lorine | -- | -- |
Source: Public Records
Mortgage History
| Date | Status | Borrower | Loan Amount |
|---|---|---|---|
| Open | Berry Jason S | $393,000 |
Source: Public Records
Tax History Compared to Growth
Tax History
| Year | Tax Paid | Tax Assessment Tax Assessment Total Assessment is a certain percentage of the fair market value that is determined by local assessors to be the total taxable value of land and additions on the property. | Land | Improvement |
|---|---|---|---|---|
| 2025 | $11,605 | $837,300 | $223,300 | $614,000 |
| 2024 | $11,841 | $836,800 | $217,100 | $619,700 |
| 2023 | $11,344 | $756,800 | $188,600 | $568,200 |
| 2022 | $10,834 | $654,200 | $148,600 | $505,600 |
| 2021 | $8,500 | $613,200 | $141,800 | $471,400 |
| 2020 | $10,484 | $616,700 | $135,600 | $481,100 |
| 2019 | $8,685 | $589,000 | $135,600 | $453,400 |
| 2018 | $41 | $570,000 | $129,300 | $440,700 |
| 2017 | $9,675 | $550,000 | $129,300 | $420,700 |
| 2016 | $9,039 | $524,000 | $123,600 | $400,400 |
| 2015 | $9,136 | $504,200 | $123,600 | $380,600 |
| 2014 | $8,861 | $499,200 | $123,600 | $375,600 |
Source: Public Records
Map
Nearby Homes
- 35 Chapin Rd
- 0 Chapin Rd
- 10 Sumac Cir
- 527 Salisbury St
- 168 Twinbrooke Dr
- 289 Bailey Rd
- 68 Fisher Rd
- 48 Lexington Cir
- 288 Fisher Rd
- 156 Newell Rd
- 47 Banbury Ln
- 7 Holmes Dr
- 9 Holmes Dr
- 33 Thorny Lea Rd
- 216 Reservoir St Unit 103
- 216 Reservoir St Unit 309
- 124 Bailey Rd
- 8 Dawson Cir
- 27 Tea Party Cir Unit 27
- 26 Avery Heights Dr