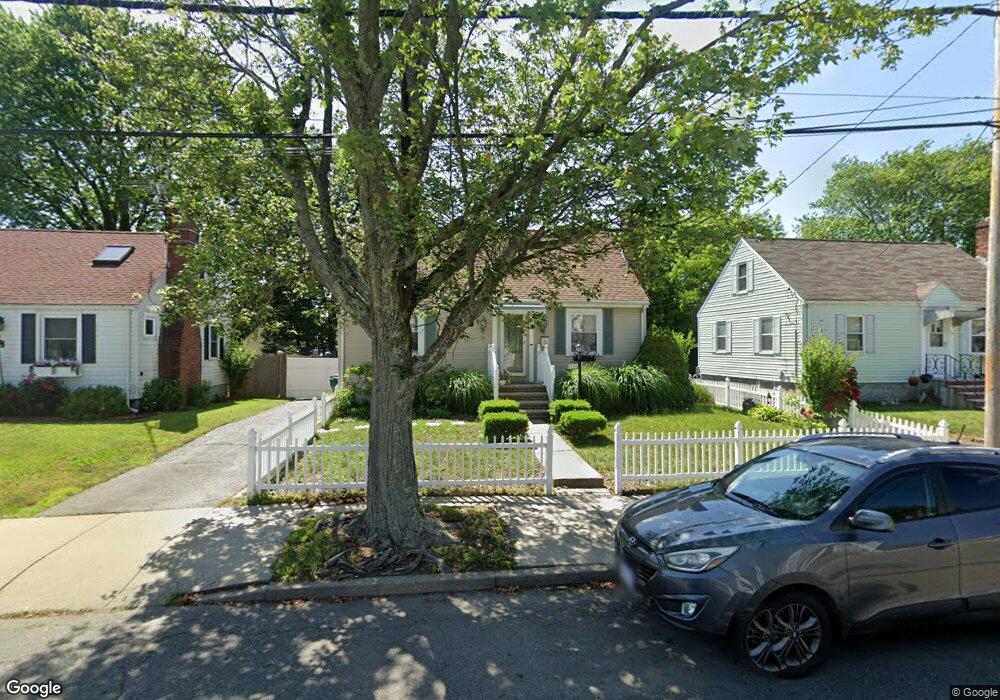
90 Childs St Lynn, MA 01905
Lower Boston Street NeighborhoodEstimated Value: $452,000 - $538,000
2
Beds
1
Bath
1,091
Sq Ft
$465/Sq Ft
Est. Value
About This Home
This home is located at 90 Childs St, Lynn, MA 01905 and is currently estimated at $507,543, approximately $465 per square foot. 90 Childs St is a home located in Essex County with nearby schools including William R. Fallon School, Lincoln-Thomson Elementary School, and Breed Middle School.
Ownership History
Date
Name
Owned For
Owner Type
Purchase Details
Closed on
Oct 18, 2011
Sold by
Curcuru Charlene G
Bought by
Charlene Irt
Current Estimated Value
Purchase Details
Closed on
Mar 27, 1992
Sold by
Curtis Elizabeth and Cordeau Joseph
Bought by
Lally G Charlene
Home Financials for this Owner
Home Financials are based on the most recent Mortgage that was taken out on this home.
Original Mortgage
$50,000
Interest Rate
8.66%
Mortgage Type
Purchase Money Mortgage
Create a Home Valuation Report for This Property
The Home Valuation Report is an in-depth analysis detailing your home's value as well as a comparison with similar homes in the area
Home Values in the Area
Average Home Value in this Area
Purchase History
| Date | Buyer | Sale Price | Title Company |
|---|---|---|---|
| Charlene Irt | -- | -- | |
| Charlene Irt | -- | -- | |
| Lally G Charlene | $90,000 | -- | |
| Lally G Charlene | $90,000 | -- |
Source: Public Records
Mortgage History
| Date | Status | Borrower | Loan Amount |
|---|---|---|---|
| Previous Owner | Lally G Charlene | $50,000 |
Source: Public Records
Tax History
| Year | Tax Paid | Tax Assessment Tax Assessment Total Assessment is a certain percentage of the fair market value that is determined by local assessors to be the total taxable value of land and additions on the property. | Land | Improvement |
|---|---|---|---|---|
| 2025 | $5,163 | $498,400 | $226,800 | $271,600 |
| 2024 | $4,734 | $449,600 | $199,200 | $250,400 |
| 2023 | $4,747 | $425,700 | $205,800 | $219,900 |
| 2022 | $4,424 | $355,900 | $152,400 | $203,500 |
| 2021 | $4,107 | $315,200 | $140,100 | $175,100 |
| 2020 | $4,044 | $301,800 | $134,900 | $166,900 |
| 2019 | $4,086 | $285,700 | $127,000 | $158,700 |
| 2018 | $4,190 | $276,600 | $140,100 | $136,500 |
| 2017 | $3,820 | $244,900 | $116,500 | $128,400 |
| 2016 | $3,720 | $229,900 | $109,000 | $120,900 |
| 2015 | $3,605 | $215,200 | $108,100 | $107,100 |
Source: Public Records
Map
Nearby Homes
- 70 Wyman St
- 50-50A Kirtland St
- 46 Wilfred St
- 73 Waterhill St
- 268 Walnut St
- 590 Boston St Unit 303
- 78-80 Spencer St
- 20 Murray St
- 16 Salem St
- 34 Grove St
- 79 Laurel St
- 99 New Park St
- 45 Cottage St Unit 3
- 32 Birch Brook Landing Unit 23
- 32 Birch Brook Landing Unit 25
- 32 Birch Brook Landing Unit 22
- 32 Birch Brook Rd Unit 13
- 32 Birch Brook Rd Unit 27
- 32 Birch Brook Rd Unit 16
- 32 Birch Brook Rd Unit 1
Your Personal Tour Guide
Ask me questions while you tour the home.