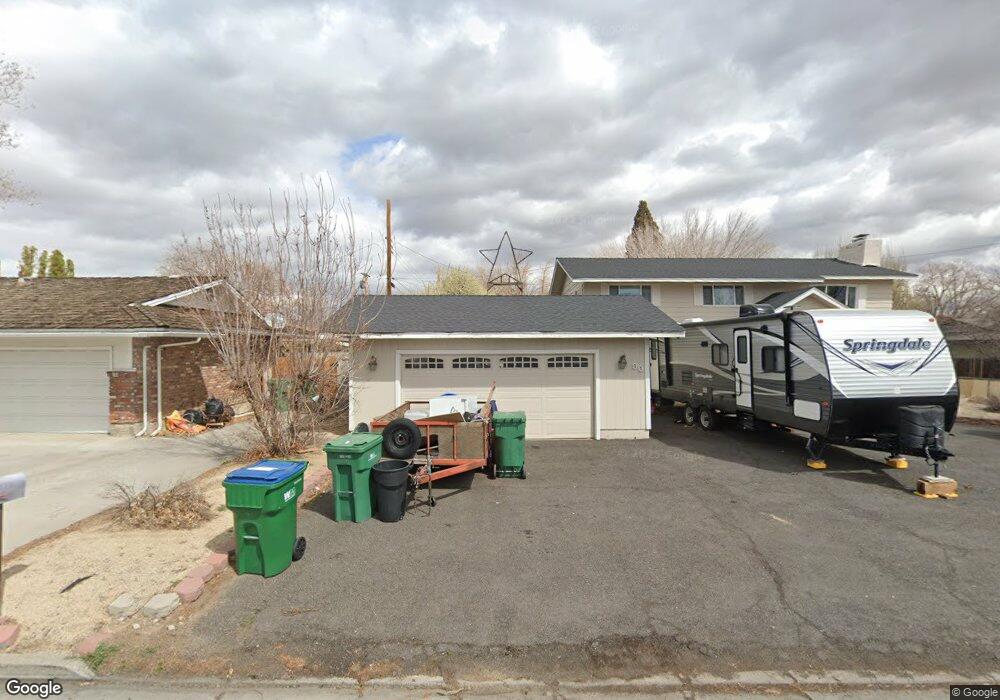
90 E Quail St Sparks, NV 89431
McCarran Boulevard-Probasco NeighborhoodEstimated Value: $468,000 - $553,000
4
Beds
3
Baths
2,376
Sq Ft
$210/Sq Ft
Est. Value
About This Home
This home is located at 90 E Quail St, Sparks, NV 89431 and is currently estimated at $499,647, approximately $210 per square foot. 90 E Quail St is a home located in Washoe County with nearby schools including Greenbrae Elementary School, George L Dilworth Middle School, and Sparks High School.
Ownership History
Date
Name
Owned For
Owner Type
Purchase Details
Closed on
Apr 22, 2022
Sold by
Hicks Wanda S
Bought by
Langdon Marjorie
Current Estimated Value
Home Financials for this Owner
Home Financials are based on the most recent Mortgage that was taken out on this home.
Original Mortgage
$213,069
Outstanding Balance
$200,676
Interest Rate
5.12%
Mortgage Type
FHA
Estimated Equity
$298,971
Purchase Details
Closed on
May 16, 2005
Sold by
Hicks Anjel C
Bought by
Hicks Gordon M and Hicks Wanda S
Home Financials for this Owner
Home Financials are based on the most recent Mortgage that was taken out on this home.
Original Mortgage
$190,000
Interest Rate
5.87%
Mortgage Type
Fannie Mae Freddie Mac
Purchase Details
Closed on
Feb 22, 2002
Sold by
Hicks Anjel C and Hicks Tabitha N
Bought by
Hicks Anjel C
Home Financials for this Owner
Home Financials are based on the most recent Mortgage that was taken out on this home.
Original Mortgage
$185,250
Interest Rate
9.25%
Purchase Details
Closed on
Nov 23, 1998
Sold by
Jensen Orlo Roy and Jensen Dori
Bought by
Hicks Anjel C and Hicks Tabitha N
Home Financials for this Owner
Home Financials are based on the most recent Mortgage that was taken out on this home.
Original Mortgage
$148,275
Interest Rate
6.84%
Mortgage Type
FHA
Create a Home Valuation Report for This Property
The Home Valuation Report is an in-depth analysis detailing your home's value as well as a comparison with similar homes in the area
Home Values in the Area
Average Home Value in this Area
Purchase History
| Date | Buyer | Sale Price | Title Company |
|---|---|---|---|
| Langdon Marjorie | $217,000 | First Centennial Title | |
| Hicks Gordon M | -- | First Centennial Title Co | |
| Hicks Anjel C | $185,250 | First Centennial Title Co | |
| Hicks Anjel C | $150,000 | United Title |
Source: Public Records
Mortgage History
| Date | Status | Borrower | Loan Amount |
|---|---|---|---|
| Open | Langdon Marjorie | $213,069 | |
| Previous Owner | Hicks Gordon M | $190,000 | |
| Previous Owner | Hicks Anjel C | $185,250 | |
| Previous Owner | Hicks Anjel C | $148,275 |
Source: Public Records
Tax History
| Year | Tax Paid | Tax Assessment Tax Assessment Total Assessment is a certain percentage of the fair market value that is determined by local assessors to be the total taxable value of land and additions on the property. | Land | Improvement |
|---|---|---|---|---|
| 2026 | $1,476 | $80,252 | $38,367 | $41,885 |
| 2024 | $1,918 | $77,907 | $36,493 | $41,414 |
| 2023 | $1,953 | $75,103 | $36,677 | $38,427 |
| 2022 | $1,809 | $60,720 | $29,878 | $30,842 |
| 2021 | $1,759 | $50,782 | $20,617 | $30,165 |
| 2020 | $1,705 | $48,828 | $18,743 | $30,085 |
| 2019 | $1,655 | $49,518 | $19,661 | $29,857 |
| 2018 | $1,607 | $44,272 | $14,222 | $30,050 |
| 2017 | $1,562 | $43,712 | $12,679 | $31,033 |
| 2016 | $1,474 | $44,676 | $12,128 | $32,548 |
| 2015 | $1,478 | $43,560 | $9,886 | $33,674 |
| 2014 | $1,429 | $41,454 | $8,379 | $33,075 |
| 2013 | -- | $39,400 | $6,284 | $33,116 |
Source: Public Records
Map
Nearby Homes
- 28 Arndell Way
- 8 E O St
- 91 E York Way
- 14 E Greenbrae Dr
- 181 Quail St
- 115 P St
- 31 E L St
- 136 York Way Unit 1
- 343 Richards Way
- 1940 4th St Unit 20
- 1940 4th St Unit 51
- 1940 4th St Unit 46
- 370 O'Brien Way
- 314 M St
- 480 E Mclean Way
- 355 York Way
- 1945 4th St Unit 22
- 1945 4th St Unit 51
- 11 E J St
- 240 E Gault Way
- 60 E Quail St
- 50 E Quail St
- 1955 Probasco Way
- 98 E Quail St
- 95 E Richards Way
- 1975 Probasco Way
- 93 E Quail St
- 75 E Richards Way
- 75 E Richards Way Unit E Richards
- 73 E Quail St
- 40 E Quail St
- 65 E Richards Way
- 69 E Quail St
- 1980 Probasco Way
- 30 E Quail St
- 29 E Quail St
- 1835 Probasco Way
- 20 E Quail St
- 90 E Richards Way
- 100 E Richards Way
Your Personal Tour Guide
Ask me questions while you tour the home.