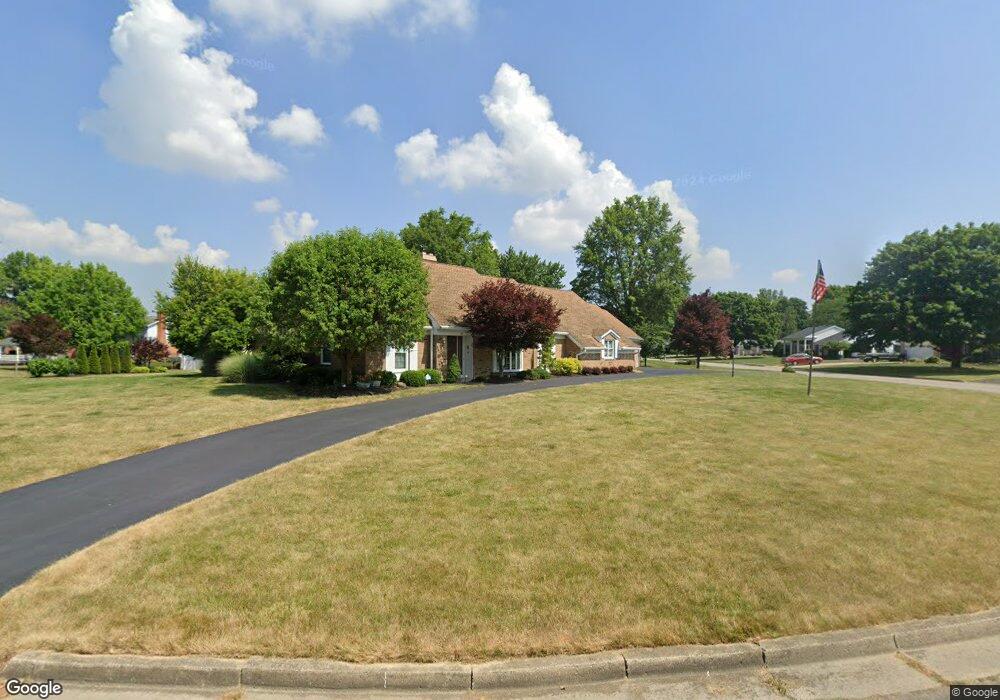
90 Harvest Ln Tiffin, OH 44883
Estimated Value: $354,000 - $499,000
5
Beds
3
Baths
3,725
Sq Ft
$120/Sq Ft
Est. Value
About This Home
This home is located at 90 Harvest Ln, Tiffin, OH 44883 and is currently estimated at $445,407, approximately $119 per square foot. 90 Harvest Ln is a home located in Seneca County with nearby schools including Columbian High School, Bridges Community Academy, and Calvert High School.
Ownership History
Date
Name
Owned For
Owner Type
Purchase Details
Closed on
Aug 12, 2019
Sold by
Wilson Bernadette T and Bernadette T Wilson Trust
Bought by
Pool David L and Pool Kathleen E
Current Estimated Value
Home Financials for this Owner
Home Financials are based on the most recent Mortgage that was taken out on this home.
Original Mortgage
$244,000
Outstanding Balance
$213,699
Interest Rate
3.7%
Mortgage Type
New Conventional
Estimated Equity
$231,708
Purchase Details
Closed on
Jun 2, 2003
Bought by
Wilson Bernadette T
Purchase Details
Closed on
Dec 3, 2001
Sold by
Wilson Bernadette T
Bought by
Wilson Bernadette T Trustee
Purchase Details
Closed on
Jun 20, 1997
Sold by
Boyd Paul C
Bought by
Wilson Bernadette T
Purchase Details
Closed on
Jul 3, 1995
Sold by
Alpay Ilhan
Bought by
Boyd Paul C
Purchase Details
Closed on
Mar 12, 1991
Sold by
Alpay Ilhan
Bought by
Alpay Ilhan
Create a Home Valuation Report for This Property
The Home Valuation Report is an in-depth analysis detailing your home's value as well as a comparison with similar homes in the area
Home Values in the Area
Average Home Value in this Area
Purchase History
| Date | Buyer | Sale Price | Title Company |
|---|---|---|---|
| Pool David L | $305,000 | Assured Title | |
| Wilson Bernadette T | -- | -- | |
| Wilson Bernadette T Trustee | -- | -- | |
| Wilson Bernadette T | $179,900 | -- | |
| Boyd Paul C | $163,000 | -- | |
| Alpay Ilhan | -- | -- |
Source: Public Records
Mortgage History
| Date | Status | Borrower | Loan Amount |
|---|---|---|---|
| Open | Pool David L | $244,000 |
Source: Public Records
Tax History Compared to Growth
Tax History
| Year | Tax Paid | Tax Assessment Tax Assessment Total Assessment is a certain percentage of the fair market value that is determined by local assessors to be the total taxable value of land and additions on the property. | Land | Improvement |
|---|---|---|---|---|
| 2024 | $4,765 | $141,180 | $15,490 | $125,690 |
| 2023 | $4,769 | $141,180 | $15,490 | $125,690 |
| 2022 | $4,230 | $103,910 | $14,570 | $89,340 |
| 2021 | $4,261 | $103,910 | $14,570 | $89,340 |
| 2020 | $4,342 | $103,912 | $14,571 | $89,341 |
| 2019 | $3,976 | $92,043 | $12,908 | $79,135 |
| 2018 | $3,984 | $92,043 | $12,908 | $79,135 |
| 2017 | $3,879 | $92,043 | $12,908 | $79,135 |
| 2016 | $3,774 | $88,456 | $12,649 | $75,807 |
| 2015 | $3,731 | $88,456 | $12,649 | $75,807 |
| 2014 | $3,514 | $88,456 | $12,649 | $75,807 |
| 2013 | $3,719 | $90,241 | $12,908 | $77,333 |
Source: Public Records
Map
Nearby Homes
- 137 Hampden Park
- 106 Sycamore Woods Ln
- 43 Siesta Dr
- 284 Sycamore St
- 38 N Tecumseh Trail
- 135 Ella St
- 134 Saint Francis Ave
- 19 Blue Bird Ln
- 505 S Washington St
- 185 Longfellow Dr
- 426 S Washington St
- 125 W Woodmere Dr
- 841 S Sandusky St
- 344 Circular St
- 50 Gross St
- 2326 Ohio 231
- 295 Circular St
- 81 Bryden Rd
- 1590 Meadowlake Dr
- 122 Ann St
- 111 Harvest Ln
- 118 Harvest Ln
- 89 Harvest Ln
- 79 Harvest Ln
- 66 Harvest Ln
- 69 Harvest Ln
- 125 Harvest Ln
- 59 Sunny Ln
- 136 Harvest Ln
- 44 Harvest Ln
- 59 Harvest Ln
- 353 W Meadows Ct
- 137 Harvest Ln
- 156 Gibson Ct
- 355 W Meadows Ct
- 67 Sunny Ln
- 67 Sunny Ln
- 491 W Williamsburg Dr
- 144 Gibson Ct
- 475 W Williamsburg Dr