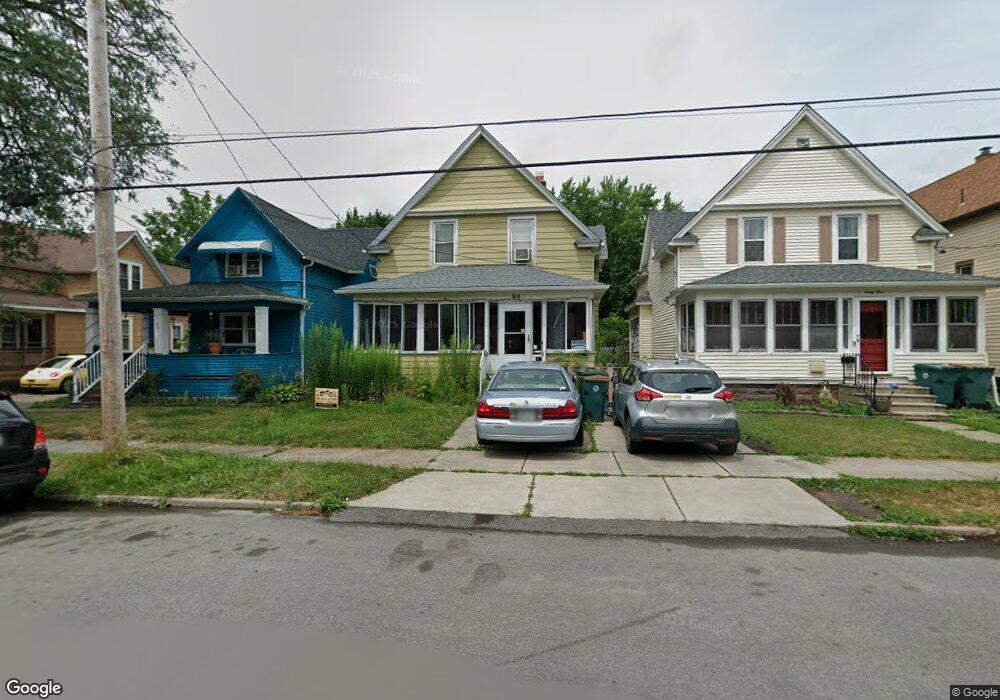
90 Keil St North Tonawanda, NY 14120
Estimated Value: $138,000 - $224,000
3
Beds
1
Bath
1,622
Sq Ft
$118/Sq Ft
Est. Value
About This Home
This home is located at 90 Keil St, North Tonawanda, NY 14120 and is currently estimated at $190,678, approximately $117 per square foot. 90 Keil St is a home located in Niagara County with nearby schools including North Tonawanda Intermediate School and St Matthew Lutheran School.
Ownership History
Date
Name
Owned For
Owner Type
Purchase Details
Closed on
May 8, 2019
Sold by
Fleck Diane M and Giuga Maureen A
Bought by
Riggs Gerald A and Riggs Kasey N
Current Estimated Value
Home Financials for this Owner
Home Financials are based on the most recent Mortgage that was taken out on this home.
Original Mortgage
$94,261
Outstanding Balance
$84,342
Interest Rate
5.12%
Mortgage Type
FHA
Estimated Equity
$106,336
Purchase Details
Closed on
Sep 29, 2000
Sold by
Mullen Alfreda P
Bought by
Ten Mullen Alfreda P-Life
Create a Home Valuation Report for This Property
The Home Valuation Report is an in-depth analysis detailing your home's value as well as a comparison with similar homes in the area
Home Values in the Area
Average Home Value in this Area
Purchase History
| Date | Buyer | Sale Price | Title Company |
|---|---|---|---|
| Riggs Gerald A | $96,000 | None Available | |
| Ten Mullen Alfreda P-Life | -- | -- |
Source: Public Records
Mortgage History
| Date | Status | Borrower | Loan Amount |
|---|---|---|---|
| Open | Riggs Gerald A | $94,261 |
Source: Public Records
Tax History Compared to Growth
Tax History
| Year | Tax Paid | Tax Assessment Tax Assessment Total Assessment is a certain percentage of the fair market value that is determined by local assessors to be the total taxable value of land and additions on the property. | Land | Improvement |
|---|---|---|---|---|
| 2024 | $2,613 | $74,000 | $13,500 | $60,500 |
| 2023 | $2,548 | $74,000 | $13,500 | $60,500 |
| 2022 | $2,520 | $74,000 | $13,500 | $60,500 |
| 2021 | $2,503 | $74,000 | $13,500 | $60,500 |
| 2020 | $2,672 | $74,000 | $13,500 | $60,500 |
| 2019 | $862 | $74,000 | $13,500 | $60,500 |
| 2018 | $850 | $74,000 | $13,500 | $60,500 |
| 2017 | $910 | $74,000 | $13,500 | $60,500 |
| 2016 | $767 | $74,000 | $13,500 | $60,500 |
| 2015 | -- | $74,000 | $13,500 | $60,500 |
| 2014 | -- | $74,000 | $13,500 | $60,500 |
Source: Public Records
Map
Nearby Homes