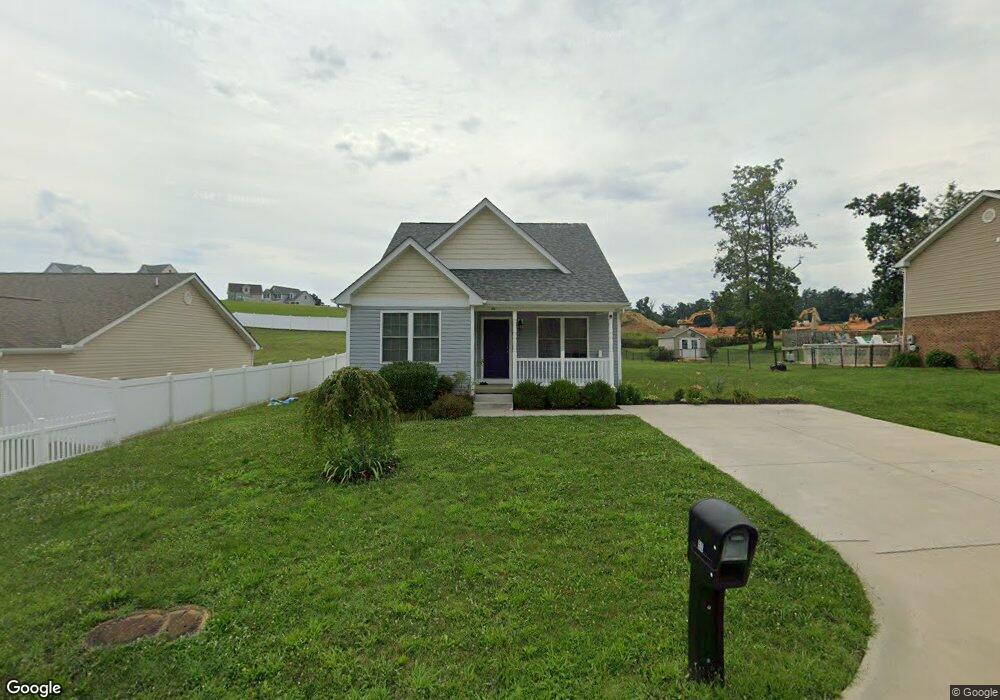
90 Lofty Cir Stuarts Draft, VA 24477
Estimated Value: $327,000 - $400,000
3
Beds
2
Baths
1,300
Sq Ft
$273/Sq Ft
Est. Value
About This Home
This home is located at 90 Lofty Cir, Stuarts Draft, VA 24477 and is currently estimated at $355,066, approximately $273 per square foot. 90 Lofty Cir is a home located in Augusta County with nearby schools including Riverheads Elementary School, Beverley Manor Middle School, and Riverheads High School.
Ownership History
Date
Name
Owned For
Owner Type
Purchase Details
Closed on
Mar 4, 2022
Sold by
Towns On Imperial Llc
Bought by
Hernandez Eusebio Mata
Current Estimated Value
Home Financials for this Owner
Home Financials are based on the most recent Mortgage that was taken out on this home.
Original Mortgage
$252,500
Interest Rate
7.25%
Mortgage Type
Seller Take Back
Purchase Details
Closed on
Feb 16, 2021
Sold by
Ward Jefrey A
Bought by
Towns On Imperial Llc
Purchase Details
Closed on
May 22, 2020
Sold by
Towns On Imperial Llc
Bought by
Leach Jerry L
Purchase Details
Closed on
May 11, 2012
Sold by
Lofton Leasing Llc A Virginia Limited Li
Bought by
Brooks Denise L
Home Financials for this Owner
Home Financials are based on the most recent Mortgage that was taken out on this home.
Original Mortgage
$176,900
Interest Rate
3.88%
Mortgage Type
New Conventional
Create a Home Valuation Report for This Property
The Home Valuation Report is an in-depth analysis detailing your home's value as well as a comparison with similar homes in the area
Purchase History
| Date | Buyer | Sale Price | Title Company |
|---|---|---|---|
| Hernandez Eusebio Mata | $283,000 | -- | |
| Towns On Imperial Llc | $219,000 | None Available | |
| Leach Jerry L | $255,000 | None Available | |
| Brooks Denise L | $196,900 | Attorney |
Source: Public Records
Mortgage History
| Date | Status | Borrower | Loan Amount |
|---|---|---|---|
| Previous Owner | Hernandez Eusebio Mata | $252,500 | |
| Previous Owner | Brooks Denise L | $176,900 |
Source: Public Records
Tax History
| Year | Tax Paid | Tax Assessment Tax Assessment Total Assessment is a certain percentage of the fair market value that is determined by local assessors to be the total taxable value of land and additions on the property. | Land | Improvement |
|---|---|---|---|---|
| 2025 | $0 | $287,300 | $60,000 | $227,300 |
| 2024 | $1,518 | $291,900 | $60,000 | $231,900 |
| 2023 | $1,286 | $204,100 | $60,000 | $144,100 |
| 2022 | $1,286 | $204,100 | $60,000 | $144,100 |
| 2021 | $1,101 | $204,100 | $60,000 | $144,100 |
| 2020 | $1,286 | $204,100 | $60,000 | $144,100 |
| 2019 | $1,286 | $204,100 | $60,000 | $144,100 |
| 2018 | $1,190 | $188,901 | $60,000 | $128,901 |
| 2017 | $1,096 | $188,901 | $60,000 | $128,901 |
| 2016 | $1,096 | $188,901 | $60,000 | $128,901 |
| 2015 | $192 | $188,901 | $60,000 | $128,901 |
| 2014 | $192 | $188,901 | $60,000 | $128,901 |
| 2013 | $192 | $161,500 | $50,000 | $111,500 |
Source: Public Records
Map
Nearby Homes
- 157 Lookover Terrace
- 86 Lookover Terrace
- 14 Lookover Terrace
- 98 Rebecca Ct
- 911 Old White Hill Rd
- 0 Johnson Dr Unit 663189
- 000 Stuarts Draft Hwy
- 1800 Stuarts Draft Hwy
- 2735 Stuarts Draft Hwy
- 81 Meriwether Cir
- 241 Bowmans Run Dr
- 1636 Stuarts Draft Hwy
- 153 Sylvan Dr
- 42 Lynn Cir
- 38 Shady Pond Ln
- 1448 Stuarts Draft Hwy
- 12 Ceocia Ln
- 124 Forest Springs Dr
- 165 Cooper Dr
- 62 Fossil Dr
- 78 Lofty Cir
- 91 Lofty Cir
- 12 Morningview Ct
- 18 Morningview Ct
- 31 Lookover Terrace
- 85 Lofty Cir
- 72 Lofty Cir
- 99 Lofty Cir
- 39 Lookover Terrace
- 87 Lookover Terrace
- 79 Lofty Cir
- 25 Lookover Terrace
- 24 Morningview Ct
- 101 Lofty Cir
- 144 Morningview Ct
- 0154 Morningview Ct
- 0153 Morningview Ct
- 155 Morningview Ct
- 154 Morningview Ct
- 153 Morningview Ct
Your Personal Tour Guide
Ask me questions while you tour the home.