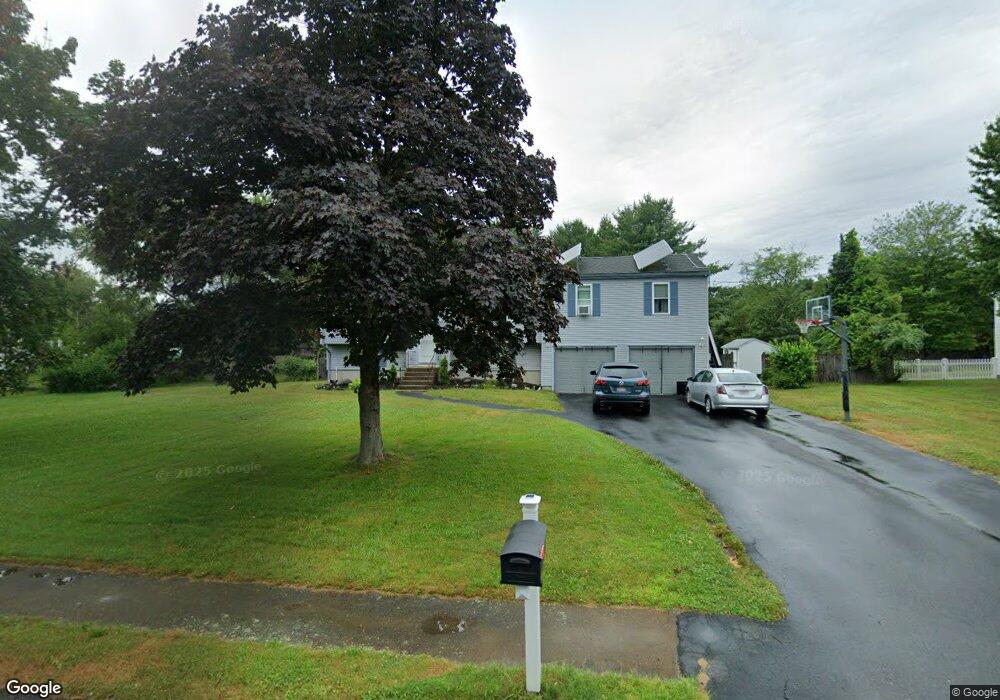
90 Lori Ln East Bridgewater, MA 02333
Estimated Value: $569,000 - $638,000
3
Beds
2
Baths
1,240
Sq Ft
$480/Sq Ft
Est. Value
About This Home
This home is located at 90 Lori Ln, East Bridgewater, MA 02333 and is currently estimated at $594,583, approximately $479 per square foot. 90 Lori Ln is a home located in Plymouth County with nearby schools including Central Elementary School, Gordon W Mitchell Middle School, and East Bridgewater Jr./Sr. High School.
Ownership History
Date
Name
Owned For
Owner Type
Purchase Details
Closed on
Feb 16, 2023
Sold by
Lecorn Barbara E
Bought by
Lecorn Jennifer R
Current Estimated Value
Create a Home Valuation Report for This Property
The Home Valuation Report is an in-depth analysis detailing your home's value as well as a comparison with similar homes in the area
Home Values in the Area
Average Home Value in this Area
Purchase History
| Date | Buyer | Sale Price | Title Company |
|---|---|---|---|
| Lecorn Jennifer R | -- | None Available |
Source: Public Records
Tax History Compared to Growth
Tax History
| Year | Tax Paid | Tax Assessment Tax Assessment Total Assessment is a certain percentage of the fair market value that is determined by local assessors to be the total taxable value of land and additions on the property. | Land | Improvement |
|---|---|---|---|---|
| 2025 | $7,205 | $527,100 | $217,700 | $309,400 |
| 2024 | $7,018 | $507,100 | $209,400 | $297,700 |
| 2023 | $6,900 | $477,500 | $209,400 | $268,100 |
| 2022 | $6,369 | $408,300 | $174,600 | $233,700 |
| 2021 | $6,111 | $358,400 | $167,700 | $190,700 |
| 2020 | $5,960 | $344,700 | $161,300 | $183,400 |
| 2019 | $5,816 | $331,200 | $154,100 | $177,100 |
| 2018 | $5,645 | $314,300 | $154,100 | $160,200 |
| 2017 | $5,485 | $299,700 | $147,000 | $152,700 |
| 2016 | $5,335 | $293,800 | $147,000 | $146,800 |
| 2015 | $4,953 | $278,900 | $132,700 | $146,200 |
| 2014 | $4,754 | $273,700 | $129,900 | $143,800 |
Source: Public Records
Map
Nearby Homes
- 446 Elm St
- 416 Highland St
- 25 Plain St
- 20 Plain St
- 50 Belmont St
- 38 Leland St
- 585 N Bedford St
- 611 N Bedford St
- 11 Willow Ave
- 139 Geralynn Dr
- 51 Darby Rd
- 505 N Central St
- 22 Water St
- 386 Matfield St
- 407 W Union St
- 24 Ithica Rd
- 11 Harmony Crossing
- 848 N Bedford St Phase III
- 848 N Bedford St Phase IV
- 848 N