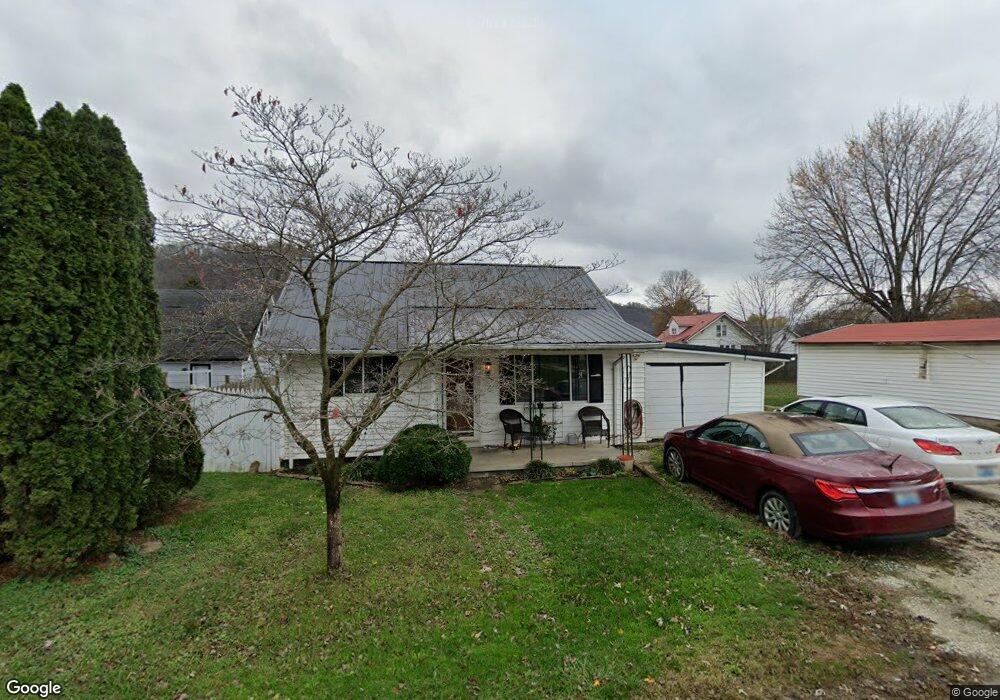
90 Main St South Shore, KY 41175
Estimated Value: $28,000 - $98,000
2
Beds
1
Bath
864
Sq Ft
$68/Sq Ft
Est. Value
About This Home
This home is located at 90 Main St, South Shore, KY 41175 and is currently estimated at $58,752, approximately $68 per square foot. 90 Main St is a home with nearby schools including Greenup County High School, Notre Dame Elementary School, and Portsmouth Stem Academy.
Ownership History
Date
Name
Owned For
Owner Type
Purchase Details
Closed on
Oct 25, 2013
Sold by
Gp Enterprises Llc
Bought by
Brown Edgar Lee and Brown Deanna
Current Estimated Value
Purchase Details
Closed on
Sep 4, 2013
Sold by
Secretary Of Housing And Urban Developme
Bought by
Talon Real Estate Inc
Purchase Details
Closed on
Nov 1, 2012
Sold by
Wells Fargo Bank Na and Brown Anna L
Bought by
Wells Fargo Bank Na and The Secretary Of Housing And Urban Devel
Create a Home Valuation Report for This Property
The Home Valuation Report is an in-depth analysis detailing your home's value as well as a comparison with similar homes in the area
Home Values in the Area
Average Home Value in this Area
Purchase History
| Date | Buyer | Sale Price | Title Company |
|---|---|---|---|
| Brown Edgar Lee | $23,750 | -- | |
| Talon Real Estate Inc | $15,900 | Regional First Title Group | |
| Wells Fargo Bank Na | $26,668 | -- |
Source: Public Records
Tax History Compared to Growth
Tax History
| Year | Tax Paid | Tax Assessment Tax Assessment Total Assessment is a certain percentage of the fair market value that is determined by local assessors to be the total taxable value of land and additions on the property. | Land | Improvement |
|---|---|---|---|---|
| 2025 | $494 | $25,000 | $12,000 | $13,000 |
| 2024 | $491 | $25,000 | $12,000 | $13,000 |
| 2023 | $466 | $25,000 | $12,000 | $13,000 |
| 2022 | $455 | $25,000 | $12,000 | $13,000 |
| 2021 | $453 | $25,000 | $12,000 | $13,000 |
| 2020 | $439 | $25,000 | $12,000 | $13,000 |
| 2019 | $456 | $25,000 | $12,000 | $13,000 |
| 2018 | $467 | $25,000 | $12,000 | $13,000 |
| 2017 | $447 | $25,000 | $12,000 | $13,000 |
| 2016 | $447 | $25,000 | $12,000 | $13,000 |
| 2015 | $442 | $25,000 | $12,000 | $13,000 |
| 2014 | $436 | $25,000 | $12,000 | $13,000 |
| 2011 | -- | $49,000 | $12,000 | $37,000 |
Source: Public Records
Map
Nearby Homes