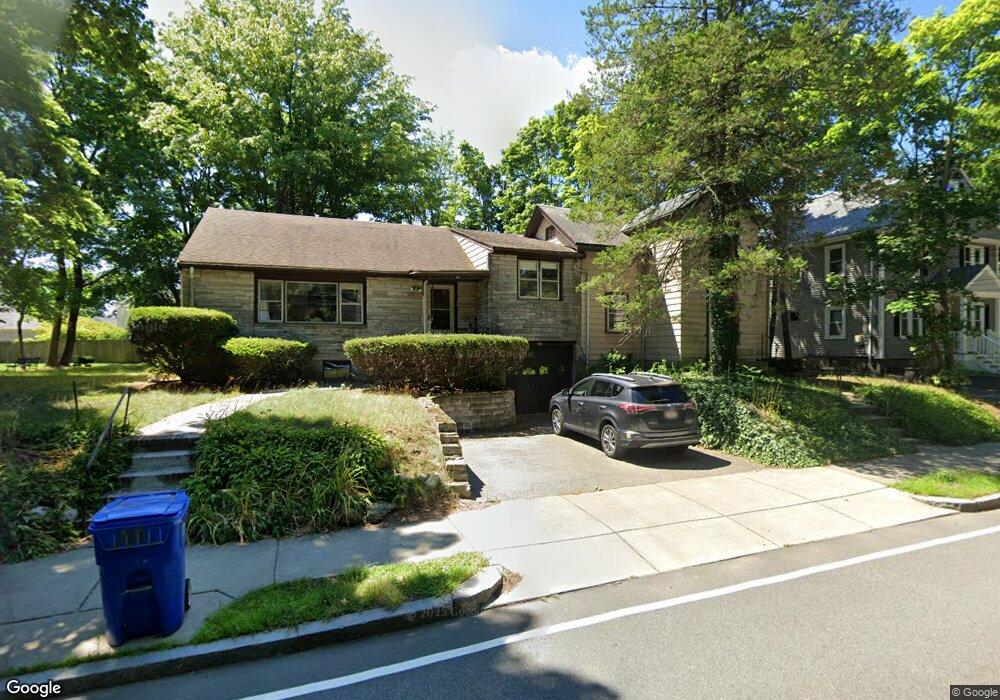
90 Mill St Newton Center, MA 02459
Newton Centre NeighborhoodEstimated Value: $1,460,000 - $1,778,000
3
Beds
3
Baths
2,348
Sq Ft
$664/Sq Ft
Est. Value
About This Home
This home is located at 90 Mill St, Newton Center, MA 02459 and is currently estimated at $1,559,135, approximately $664 per square foot. 90 Mill St is a home located in Middlesex County with nearby schools including Mason Rice Elementary School, Charles E Brown Middle School, and Newton North High School.
Ownership History
Date
Name
Owned For
Owner Type
Purchase Details
Closed on
May 25, 2021
Sold by
Micley Dena Est
Bought by
Micley Molly and Micley David S
Current Estimated Value
Home Financials for this Owner
Home Financials are based on the most recent Mortgage that was taken out on this home.
Original Mortgage
$724,495
Outstanding Balance
$656,573
Interest Rate
3.1%
Mortgage Type
Purchase Money Mortgage
Estimated Equity
$902,562
Create a Home Valuation Report for This Property
The Home Valuation Report is an in-depth analysis detailing your home's value as well as a comparison with similar homes in the area
Home Values in the Area
Average Home Value in this Area
Purchase History
| Date | Buyer | Sale Price | Title Company |
|---|---|---|---|
| Micley Molly | $1,040,000 | None Available |
Source: Public Records
Mortgage History
| Date | Status | Borrower | Loan Amount |
|---|---|---|---|
| Open | Micley Molly | $724,495 |
Source: Public Records
Tax History Compared to Growth
Tax History
| Year | Tax Paid | Tax Assessment Tax Assessment Total Assessment is a certain percentage of the fair market value that is determined by local assessors to be the total taxable value of land and additions on the property. | Land | Improvement |
|---|---|---|---|---|
| 2025 | $13,179 | $1,344,800 | $0 | $0 |
| 2024 | $12,743 | $0 | $0 | $0 |
| 2023 | $12,103 | $1,188,900 | $1,008,800 | $180,100 |
| 2022 | $11,580 | $1,100,800 | $934,100 | $166,700 |
| 2021 | $11,174 | $1,038,500 | $881,200 | $157,300 |
| 2020 | $10,842 | $1,038,500 | $881,200 | $157,300 |
| 2019 | $10,537 | $1,008,300 | $855,500 | $152,800 |
| 2018 | $9,951 | $919,700 | $768,100 | $151,600 |
| 2017 | $9,648 | $867,600 | $724,600 | $143,000 |
| 2016 | $9,227 | $810,800 | $677,200 | $133,600 |
| 2015 | $8,798 | $757,800 | $632,900 | $124,900 |
Source: Public Records
Map
Nearby Homes
- 73 Elmore St
- 3 Cedar St
- 1004 Centre St
- 34 Morton Rd
- 95 Blake St
- 887 Commonwealth Ave
- 31 W Boulevard Rd
- 44 Irving St
- 21 Francis St Unit 21A
- 23 Francis St Unit 23-1
- Lots 2 & 3 Chapin Rd
- Lot 3 Chapin Rd
- Lot 2 Chapin Rd
- 59 Charlotte Rd
- 206-208 Cabot St
- 300 Cabot St
- 110 Harvard St
- 92 Grant Ave
- 61 Lakeview Ave
- 10 Washington Park
- 90 Mill St Unit 1
- 90 Mill St Unit 90
- 86 Stuart Rd
- 78 Mill St
- 92 Mill St
- 92 Mill St Unit 2
- 23 Channing Rd
- 15 Channing Rd
- 6 Morseland Ave
- 74 Mill St
- 31 Channing Rd
- 9 Channing Rd
- 15 Clinton Place
- 66 Mill St
- 24 Channing Rd Unit 26
- 3 Applegarth St
- 5 Morseland Ave
- 5 Channing Rd
- 68 Mill St
- 22 Morseland Ave