90 Myrtle St Methuen, MA 01844
The West End NeighborhoodEstimated Value: $542,000 - $735,000
3
Beds
1
Bath
1,938
Sq Ft
$319/Sq Ft
Est. Value
About This Home
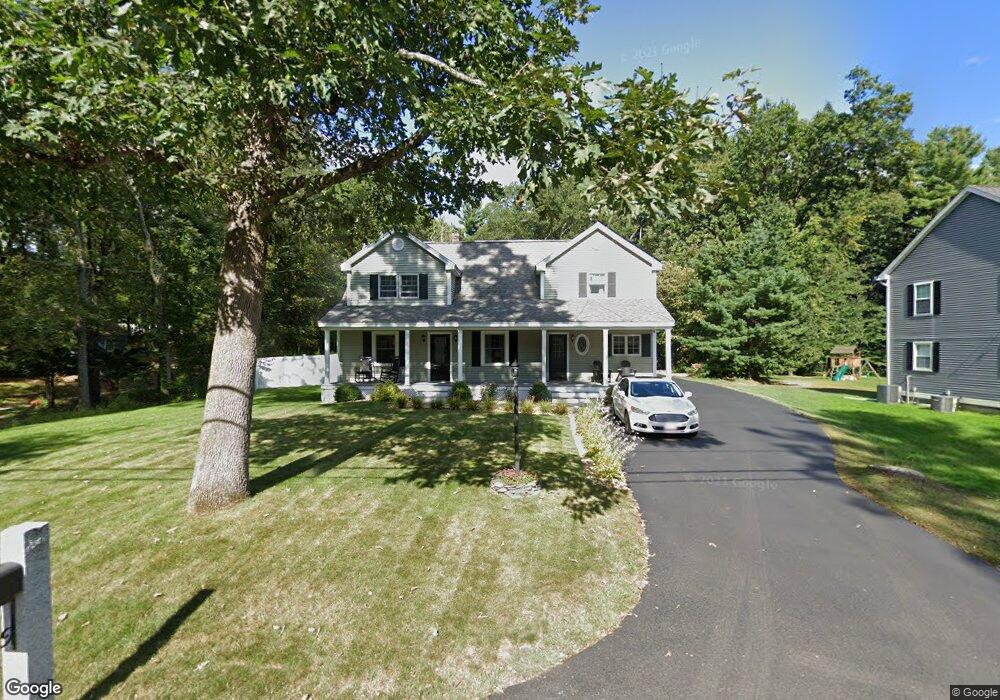
This home is located at 90 Myrtle St, Methuen, MA 01844 and is currently estimated at $617,708, approximately $318 per square foot. 90 Myrtle St is a home located in Essex County with nearby schools including Marsh Grammar School, South Point Elementary School, and Methuen High School.
Ownership History
Date
Name
Owned For
Owner Type
Purchase Details
Closed on
Aug 1, 2002
Sold by
Timmins Thomas F and Timmins Patricia A
Bought by
Torrisi Jeffrey J and Torrisi Kellie A
Current Estimated Value
Home Financials for this Owner
Home Financials are based on the most recent Mortgage that was taken out on this home.
Original Mortgage
$187,200
Outstanding Balance
$79,723
Interest Rate
6.64%
Mortgage Type
Purchase Money Mortgage
Estimated Equity
$537,985
Purchase Details
Closed on
Jul 31, 1997
Sold by
Hull Michael R
Bought by
Timmins Thomas F
Purchase Details
Closed on
Jun 2, 1992
Sold by
Vachon Leo A
Bought by
Hull Michael R
Create a Home Valuation Report for This Property
The Home Valuation Report is an in-depth analysis detailing your home's value as well as a comparison with similar homes in the area
Home Values in the Area
Average Home Value in this Area
Purchase History
| Date | Buyer | Sale Price | Title Company |
|---|---|---|---|
| Torrisi Jeffrey J | $234,000 | -- | |
| Torrisi Jeffrey J | $234,000 | -- | |
| Timmins Thomas F | $120,000 | -- | |
| Timmins Thomas F | $120,000 | -- | |
| Hull Michael R | $114,000 | -- | |
| Hull Michael R | $114,000 | -- |
Source: Public Records
Mortgage History
| Date | Status | Borrower | Loan Amount |
|---|---|---|---|
| Open | Hull Michael R | $187,200 | |
| Closed | Hull Michael R | $187,200 |
Source: Public Records
Tax History Compared to Growth
Tax History
| Year | Tax Paid | Tax Assessment Tax Assessment Total Assessment is a certain percentage of the fair market value that is determined by local assessors to be the total taxable value of land and additions on the property. | Land | Improvement |
|---|---|---|---|---|
| 2025 | $5,650 | $534,000 | $237,800 | $296,200 |
| 2024 | $5,577 | $513,500 | $216,900 | $296,600 |
| 2023 | $5,243 | $448,100 | $192,800 | $255,300 |
| 2022 | $4,963 | $380,300 | $160,700 | $219,600 |
| 2021 | $4,723 | $358,100 | $152,700 | $205,400 |
| 2020 | $4,736 | $352,400 | $152,700 | $199,700 |
| 2019 | $4,450 | $313,600 | $136,600 | $177,000 |
| 2018 | $4,357 | $305,300 | $136,600 | $168,700 |
| 2017 | $4,222 | $288,200 | $136,600 | $151,600 |
| 2016 | $3,774 | $254,800 | $128,600 | $126,200 |
| 2015 | $3,616 | $247,700 | $128,600 | $119,100 |
Source: Public Records
Map
Nearby Homes