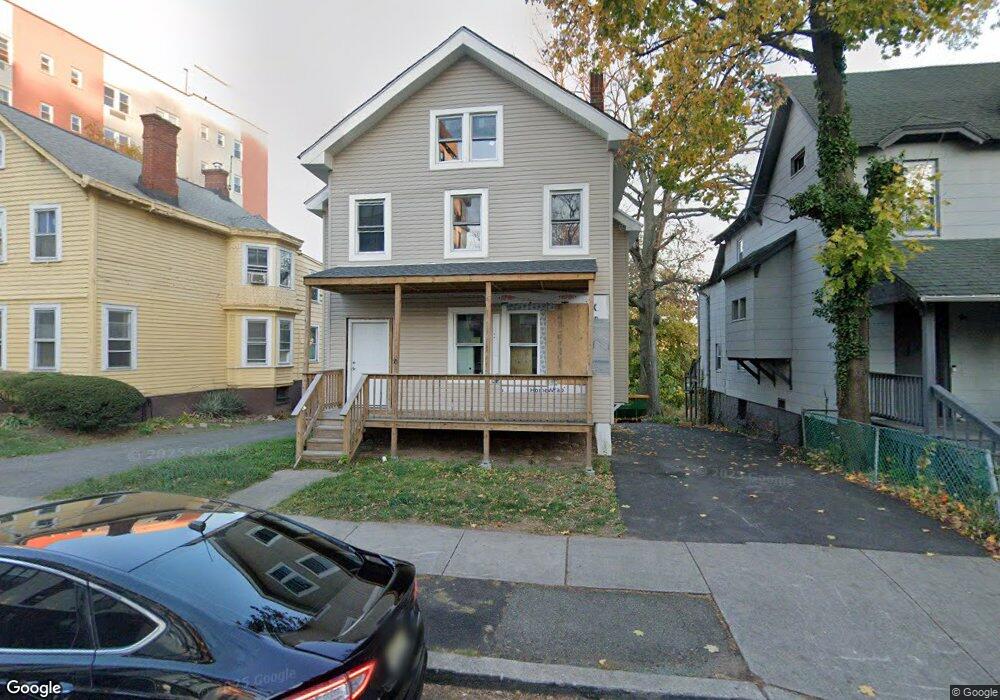
90 N Grove St Unit 2 East Orange, NJ 07017
Estimated Value: $434,000 - $768,000
--
Bed
4
Baths
2,164
Sq Ft
$310/Sq Ft
Est. Value
About This Home
This home is located at 90 N Grove St Unit 2, East Orange, NJ 07017 and is currently estimated at $669,951, approximately $309 per square foot. 90 N Grove St Unit 2 is a home located in Essex County with nearby schools including Mildred B. Garvin School, John L Costley Middle School, and Patrick F Healy Middle School.
Ownership History
Date
Name
Owned For
Owner Type
Purchase Details
Closed on
Mar 26, 2024
Sold by
Bmg Investment Properties Llc
Bought by
New Rise Estates Llc
Current Estimated Value
Home Financials for this Owner
Home Financials are based on the most recent Mortgage that was taken out on this home.
Original Mortgage
$475,160
Interest Rate
6.29%
Mortgage Type
Construction
Purchase Details
Closed on
Feb 1, 2022
Sold by
Ali Lydia A
Bought by
Bmg Investment Properties Llc
Home Financials for this Owner
Home Financials are based on the most recent Mortgage that was taken out on this home.
Original Mortgage
$288,400
Interest Rate
3.56%
Mortgage Type
Construction
Purchase Details
Closed on
May 14, 1992
Sold by
Hobson Thelma M
Bought by
Hobson Weldon
Create a Home Valuation Report for This Property
The Home Valuation Report is an in-depth analysis detailing your home's value as well as a comparison with similar homes in the area
Home Values in the Area
Average Home Value in this Area
Purchase History
| Date | Buyer | Sale Price | Title Company |
|---|---|---|---|
| New Rise Estates Llc | $390,000 | None Listed On Document | |
| Bmg Investment Properties Llc | $170,000 | New Title Company Name | |
| Hobson Weldon | -- | -- | |
| Hobson Weldon | -- | -- |
Source: Public Records
Mortgage History
| Date | Status | Borrower | Loan Amount |
|---|---|---|---|
| Closed | New Rise Estates Llc | $475,160 | |
| Previous Owner | Bmg Investment Properties Llc | $288,400 |
Source: Public Records
Tax History Compared to Growth
Tax History
| Year | Tax Paid | Tax Assessment Tax Assessment Total Assessment is a certain percentage of the fair market value that is determined by local assessors to be the total taxable value of land and additions on the property. | Land | Improvement |
|---|---|---|---|---|
| 2025 | $6,051 | $382,900 | $70,200 | $312,700 |
| 2024 | $6,051 | $191,000 | $70,200 | $120,800 |
| 2023 | $5,550 | $191,000 | $70,200 | $120,800 |
| 2022 | $5,550 | $191,000 | $70,200 | $120,800 |
| 2021 | $9,043 | $163,200 | $59,100 | $104,100 |
| 2020 | $8,927 | $163,200 | $59,100 | $104,100 |
| 2019 | $8,813 | $163,200 | $59,100 | $104,100 |
| 2018 | $8,703 | $163,200 | $59,100 | $104,100 |
| 2017 | $8,460 | $163,200 | $59,100 | $104,100 |
| 2016 | $8,328 | $163,200 | $59,100 | $104,100 |
| 2015 | $8,124 | $163,200 | $59,100 | $104,100 |
| 2014 | $8,010 | $163,200 | $59,100 | $104,100 |
Source: Public Records
Map
Nearby Homes
- 90 N Grove St
- 65 N Grove St
- 43 Grove Place
- 118 N Grove St
- 61 N Grove St
- 39 New St
- 101 Eaton Place
- 133 N Maple Ave Unit 204
- 92 N Oraton Pkwy
- 129 Greenwood Ave
- 57 New St
- 80 N Oraton Pkwy
- 97 William St
- 147 Greenwood Ave
- 78 Eaton Place
- 83 N 19th St
- 152 Greenwood Ave Unit 2
- 97 N 19th St
- 256 William St
- 103 N 19th St
- 94 N Grove St
- 86 N Grove St
- 98 N Grove St
- 98 N Grove St Unit A
- 80 N Grove St
- 76 N Grove St
- 76 N Grove St Unit 2
- 76 N Grove St Unit 1
- 106 N Grove St Unit 312
- 106 N Grove St Unit 306
- 106 N Grove St Unit 602
- 106 N Grove St Unit 102
- 106 N Grove St Unit 608
- 89 N Grove St
- 85 N Grove St
- 81 N Grove St Unit 3
- 81 N Grove St Unit 2
- 75 N Grove St
- 79 N Grove St Unit 2
- 79 N Grove St