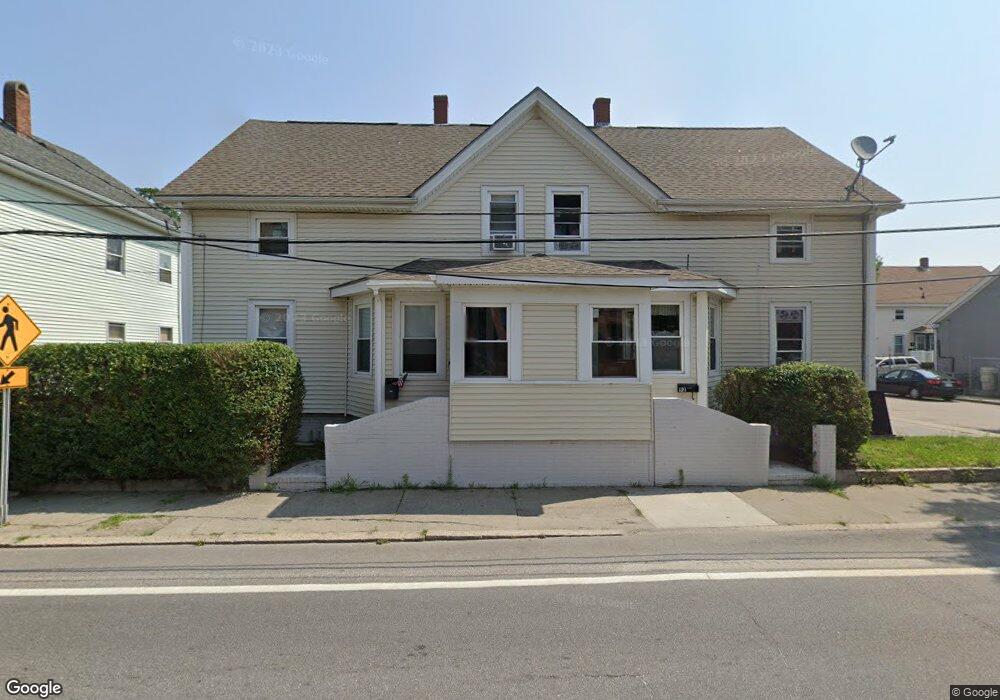
90 N Main St Warren, RI 02885
Downtown Warren NeighborhoodEstimated Value: $504,000 - $553,591
8
Beds
2
Baths
2,252
Sq Ft
$235/Sq Ft
Est. Value
About This Home
This home is located at 90 N Main St, Warren, RI 02885 and is currently estimated at $528,898, approximately $234 per square foot. 90 N Main St is a home located in Bristol County with nearby schools including Mt. Hope High School, Highlander Charter Middle and High School, and East Bay Career Academy.
Ownership History
Date
Name
Owned For
Owner Type
Purchase Details
Closed on
Mar 29, 2021
Sold by
Warren Main Street Llc
Bought by
Revitalize Warren Llc
Current Estimated Value
Purchase Details
Closed on
Jun 4, 2014
Sold by
Quirk Mitchell J and Quirk Matthew J
Bought by
Warren Main St Llc
Purchase Details
Closed on
Oct 4, 2013
Sold by
Faria Abilio and Faria Brian
Bought by
Quirk Mitchell J and Quirk Matthew J
Home Financials for this Owner
Home Financials are based on the most recent Mortgage that was taken out on this home.
Original Mortgage
$138,750
Interest Rate
4.61%
Purchase Details
Closed on
Jan 4, 2005
Sold by
Baxter Daniel
Bought by
Faria Brian and Faria Lucille
Home Financials for this Owner
Home Financials are based on the most recent Mortgage that was taken out on this home.
Original Mortgage
$175,000
Interest Rate
5.73%
Mortgage Type
Purchase Money Mortgage
Create a Home Valuation Report for This Property
The Home Valuation Report is an in-depth analysis detailing your home's value as well as a comparison with similar homes in the area
Home Values in the Area
Average Home Value in this Area
Purchase History
| Date | Buyer | Sale Price | Title Company |
|---|---|---|---|
| Revitalize Warren Llc | $310,000 | None Available | |
| Warren Main St Llc | -- | -- | |
| Quirk Mitchell J | $185,000 | -- | |
| Faria Brian | $219,000 | -- |
Source: Public Records
Mortgage History
| Date | Status | Borrower | Loan Amount |
|---|---|---|---|
| Previous Owner | Faria Brian | $138,750 | |
| Previous Owner | Faria Brian | $175,000 |
Source: Public Records
Tax History
| Year | Tax Paid | Tax Assessment Tax Assessment Total Assessment is a certain percentage of the fair market value that is determined by local assessors to be the total taxable value of land and additions on the property. | Land | Improvement |
|---|---|---|---|---|
| 2025 | $4,862 | $326,500 | $76,100 | $250,400 |
| 2024 | $4,715 | $326,500 | $76,100 | $250,400 |
| 2023 | $4,460 | $326,500 | $76,100 | $250,400 |
| 2022 | $4,032 | $223,900 | $70,400 | $153,500 |
| 2021 | $3,968 | $223,900 | $70,400 | $153,500 |
| 2020 | $3,887 | $223,900 | $70,400 | $153,500 |
| 2019 | $2,819 | $147,500 | $44,700 | $102,800 |
| 2018 | $2,782 | $147,500 | $44,700 | $102,800 |
| 2017 | $2,774 | $147,500 | $44,700 | $102,800 |
| 2016 | $3,121 | $156,300 | $43,500 | $112,800 |
| 2015 | $3,121 | $156,300 | $43,500 | $112,800 |
| 2014 | $3,137 | $156,300 | $43,500 | $112,800 |
Source: Public Records
Map
Nearby Homes
- 90 Main St
- 90 Main St Unit 1
- 92 Main St Unit 1
- 92 Main St
- 82 Main St
- 6 Mill St
- 18 Crescent St
- 10 Mill St Unit 1
- 10 Mill St
- 100 Main St
- 9 Crescent St
- 74 Main St
- 12 Mill St
- 12 Mill St Unit 2E
- 12 Mill St Unit L
- 12 Mill St Unit C
- 12 Mill St Unit 1
- 12 Mill St Unit B
- 91 Main St Unit 302
- 91 Main St Unit 204
Your Personal Tour Guide
Ask me questions while you tour the home.