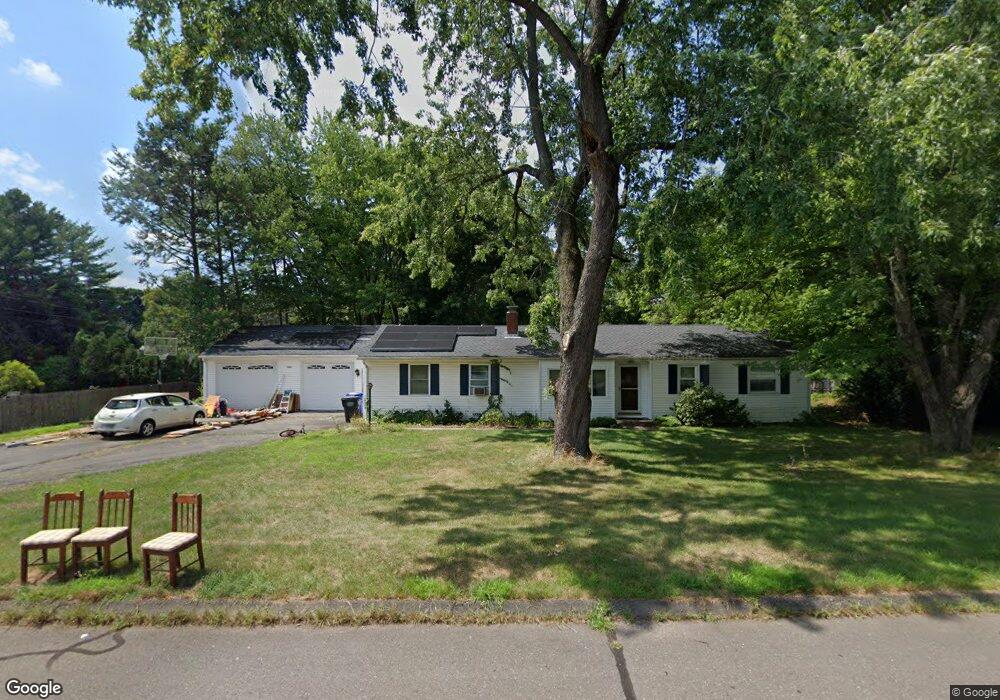
90 Overlook Rd South Windsor, CT 06074
Estimated Value: $371,000 - $422,441
3
Beds
2
Baths
1,386
Sq Ft
$288/Sq Ft
Est. Value
About This Home
This home is located at 90 Overlook Rd, South Windsor, CT 06074 and is currently estimated at $399,860, approximately $288 per square foot. 90 Overlook Rd is a home located in Hartford County with nearby schools including Timothy Edwards School and South Windsor High School.
Ownership History
Date
Name
Owned For
Owner Type
Purchase Details
Closed on
May 10, 2006
Sold by
Merritt Anne
Bought by
Chandler Jesse and Chandler Bryn
Current Estimated Value
Home Financials for this Owner
Home Financials are based on the most recent Mortgage that was taken out on this home.
Original Mortgage
$235,042
Interest Rate
6.4%
Purchase Details
Closed on
Dec 3, 2004
Sold by
Decesare Joseph and Decesare Dawn
Bought by
Merritt Anne
Purchase Details
Closed on
Apr 27, 1999
Sold by
Grenier Robert
Bought by
Dicesare Joseph and Dicesare Dawn
Create a Home Valuation Report for This Property
The Home Valuation Report is an in-depth analysis detailing your home's value as well as a comparison with similar homes in the area
Home Values in the Area
Average Home Value in this Area
Purchase History
| Date | Buyer | Sale Price | Title Company |
|---|---|---|---|
| Chandler Jesse | $236,000 | -- | |
| Merritt Anne | $218,000 | -- | |
| Dicesare Joseph | $95,000 | -- |
Source: Public Records
Mortgage History
| Date | Status | Borrower | Loan Amount |
|---|---|---|---|
| Open | Dicesare Joseph | $225,992 | |
| Closed | Dicesare Joseph | $235,042 | |
| Closed | Dicesare Joseph | $9,600 |
Source: Public Records
Tax History Compared to Growth
Tax History
| Year | Tax Paid | Tax Assessment Tax Assessment Total Assessment is a certain percentage of the fair market value that is determined by local assessors to be the total taxable value of land and additions on the property. | Land | Improvement |
|---|---|---|---|---|
| 2025 | $7,371 | $207,000 | $94,500 | $112,500 |
| 2024 | $7,133 | $207,000 | $94,500 | $112,500 |
| 2023 | $6,860 | $207,000 | $94,500 | $112,500 |
| 2022 | $5,579 | $143,900 | $87,500 | $56,400 |
| 2021 | $5,448 | $143,900 | $87,500 | $56,400 |
| 2020 | $5,451 | $143,900 | $87,500 | $56,400 |
| 2019 | $5,540 | $143,900 | $87,500 | $56,400 |
| 2018 | $5,421 | $143,900 | $87,500 | $56,400 |
| 2017 | $5,571 | $146,300 | $87,500 | $58,800 |
| 2016 | $5,463 | $146,300 | $87,500 | $58,800 |
| 2015 | $5,346 | $146,300 | $87,500 | $58,800 |
| 2014 | $5,195 | $146,300 | $87,500 | $58,800 |
Source: Public Records
Map
Nearby Homes
- 50 High St
- 31 Wendy Dr
- 76 Griffin Rd
- 74 Alison Dr
- 668 Sullivan Ave
- 88 Andreis Trail
- 35 Dower Rd
- 59 Saginaw St
- 40 Barber Hill Rd
- 835 Foster Street Extension
- 51 Carriage Dr
- 2560 Ellington Rd
- 2719 Ellington Rd
- 2773 Ellington Rd
- 11 Kupchunos Rd
- 43 W River Rd
- 816 Sand Stone Dr Unit 816
- 23 Cathy (Lot 21) Ln
- 29 W River Rd
- 26 Cathy (Lot 13) Ln