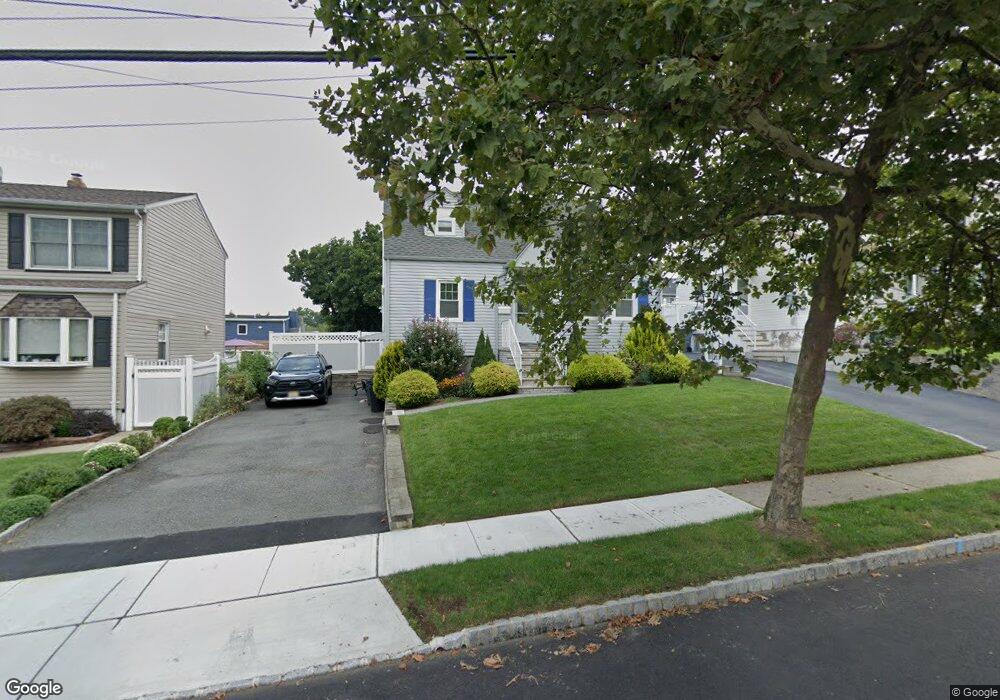
90 Ozone Ave Cedar Grove, NJ 07009
Estimated Value: $569,000 - $632,746
--
Bed
--
Bath
1,220
Sq Ft
$491/Sq Ft
Est. Value
About This Home
This home is located at 90 Ozone Ave, Cedar Grove, NJ 07009 and is currently estimated at $598,437, approximately $490 per square foot. 90 Ozone Ave is a home located in Essex County with nearby schools including Cedar Grove High School, St Catherine Of Siena School, and Our Lady of the Lake School.
Ownership History
Date
Name
Owned For
Owner Type
Purchase Details
Closed on
Mar 5, 2009
Sold by
Vold Phyllis
Bought by
James Stephen and Ramos James Lori Ann
Current Estimated Value
Home Financials for this Owner
Home Financials are based on the most recent Mortgage that was taken out on this home.
Original Mortgage
$270,019
Outstanding Balance
$171,786
Interest Rate
5.14%
Mortgage Type
FHA
Estimated Equity
$426,651
Create a Home Valuation Report for This Property
The Home Valuation Report is an in-depth analysis detailing your home's value as well as a comparison with similar homes in the area
Home Values in the Area
Average Home Value in this Area
Purchase History
| Date | Buyer | Sale Price | Title Company |
|---|---|---|---|
| James Stephen | $275,000 | Land Title Agency Inc |
Source: Public Records
Mortgage History
| Date | Status | Borrower | Loan Amount |
|---|---|---|---|
| Open | James Stephen | $270,019 |
Source: Public Records
Tax History Compared to Growth
Tax History
| Year | Tax Paid | Tax Assessment Tax Assessment Total Assessment is a certain percentage of the fair market value that is determined by local assessors to be the total taxable value of land and additions on the property. | Land | Improvement |
|---|---|---|---|---|
| 2025 | $7,290 | $279,300 | $183,500 | $95,800 |
| 2024 | $7,290 | $279,300 | $183,500 | $95,800 |
| 2022 | $7,161 | $279,300 | $183,500 | $95,800 |
| 2021 | $7,075 | $279,300 | $183,500 | $95,800 |
| 2020 | $7,178 | $279,300 | $183,500 | $95,800 |
| 2019 | $7,013 | $279,300 | $183,500 | $95,800 |
| 2018 | $6,692 | $279,300 | $183,500 | $95,800 |
| 2017 | $6,619 | $279,300 | $183,500 | $95,800 |
| 2016 | $6,416 | $279,300 | $183,500 | $95,800 |
| 2015 | $6,267 | $279,300 | $183,500 | $95,800 |
| 2014 | $6,139 | $271,100 | $183,500 | $87,600 |
Source: Public Records
Map
Nearby Homes