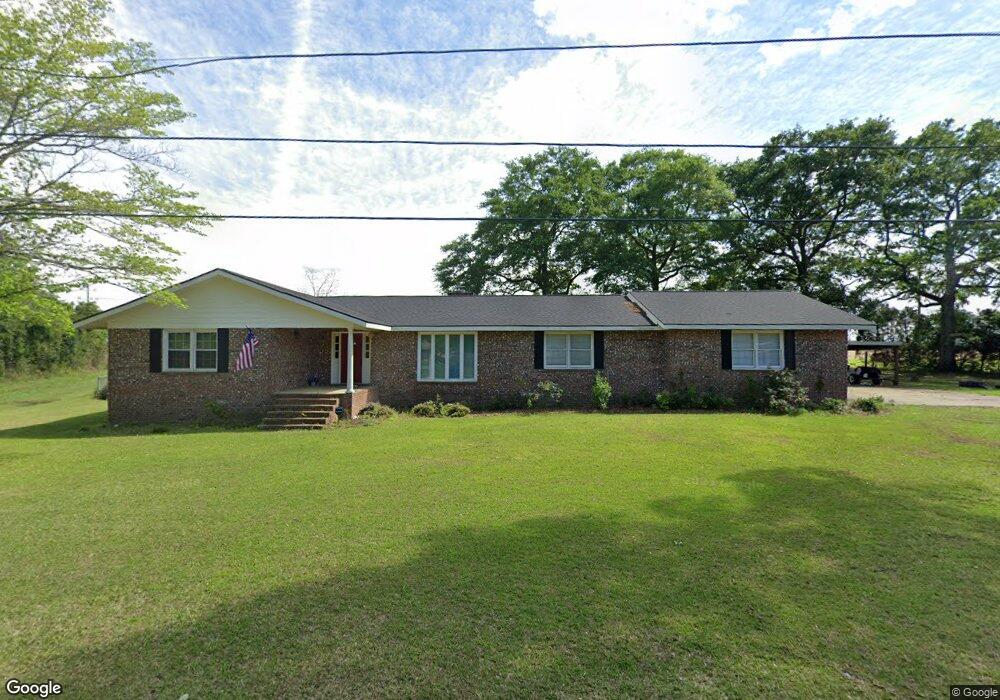
90 Pine Hill Cir Camilla, GA 31730
Estimated Value: $247,000 - $288,000
3
Beds
2
Baths
2,800
Sq Ft
$93/Sq Ft
Est. Value
About This Home
This home is located at 90 Pine Hill Cir, Camilla, GA 31730 and is currently estimated at $261,532, approximately $93 per square foot. 90 Pine Hill Cir is a home located in Mitchell County with nearby schools including Mitchell County Primary School, Mitchell County Elementary School, and Mitchell County Middle School.
Ownership History
Date
Name
Owned For
Owner Type
Purchase Details
Closed on
Mar 2, 2020
Sold by
Humphries Marsha H
Bought by
Bell James Edwin
Current Estimated Value
Home Financials for this Owner
Home Financials are based on the most recent Mortgage that was taken out on this home.
Original Mortgage
$188,560
Interest Rate
3.6%
Mortgage Type
New Conventional
Purchase Details
Closed on
May 21, 2015
Sold by
Humphries Jared
Bought by
Humphries Marsha H
Purchase Details
Closed on
Dec 23, 2009
Sold by
Humphries Jared
Bought by
Humphries Jared and Humphries Kimberly
Purchase Details
Closed on
Dec 9, 2009
Sold by
Humphries Kimberly
Bought by
Humphries Jared
Purchase Details
Closed on
Mar 19, 2007
Sold by
Parramore Charles
Bought by
Humphries Jared and Humphries Kimberly
Home Financials for this Owner
Home Financials are based on the most recent Mortgage that was taken out on this home.
Original Mortgage
$112,450
Interest Rate
6.27%
Mortgage Type
New Conventional
Create a Home Valuation Report for This Property
The Home Valuation Report is an in-depth analysis detailing your home's value as well as a comparison with similar homes in the area
Home Values in the Area
Average Home Value in this Area
Purchase History
| Date | Buyer | Sale Price | Title Company |
|---|---|---|---|
| Bell James Edwin | $155,000 | -- | |
| Humphries Marsha H | -- | -- | |
| Humphries Jared | -- | -- | |
| Humphries Jared | -- | -- | |
| Humphries Jared | $122,450 | -- |
Source: Public Records
Mortgage History
| Date | Status | Borrower | Loan Amount |
|---|---|---|---|
| Closed | Bell James Edwin | $188,560 | |
| Previous Owner | Humphries Jared | $112,450 |
Source: Public Records
Tax History Compared to Growth
Tax History
| Year | Tax Paid | Tax Assessment Tax Assessment Total Assessment is a certain percentage of the fair market value that is determined by local assessors to be the total taxable value of land and additions on the property. | Land | Improvement |
|---|---|---|---|---|
| 2024 | $3,328 | $84,745 | $5,360 | $79,385 |
| 2023 | $3,562 | $84,745 | $5,360 | $79,385 |
| 2022 | $2,794 | $66,465 | $5,360 | $61,105 |
| 2021 | $2,533 | $60,265 | $5,360 | $54,905 |
| 2020 | $2,464 | $60,265 | $5,360 | $54,905 |
| 2019 | $2,454 | $60,265 | $5,360 | $54,905 |
| 2018 | $2,630 | $60,291 | $5,386 | $54,905 |
| 2017 | $2,737 | $65,008 | $5,386 | $59,622 |
| 2016 | $2,703 | $65,008 | $5,386 | $59,622 |
| 2015 | $2,703 | $65,008 | $5,386 | $59,622 |
| 2014 | $2,703 | $65,008 | $5,386 | $59,622 |
| 2013 | $2,703 | $65,008 | $5,386 | $59,622 |
Source: Public Records
Map
Nearby Homes
- 95 Pine Hill Cir
- 85 Pine Hill Cir
- 70 Pine Hill Cir
- 75 Pine Hill Cir
- 60 Pine Hill Cir
- 115 Pine Hill Cir
- 120 Pine Hill Cir
- 65 Pine Hill Cir
- 70 Pine Cone St
- 50 Pine Hill Cir
- 114 Stadium Dr
- 124 Stadium Dr
- 25 Pine Hill Cir
- 94 Stadium Dr
- 134 Stadium Dr
- 40 Pine Hill Cir
- 144 Stadium Dr
- 30 Pine Hill Cir
- 74 Stadium Dr
- 5 Pine Hill Cir