
Landlord's Agent in 2024
Colleen Foulsham
FC Realty Group
(857) 939-0144
1 in this area
108 Total Sales


Estimated Value: $393,000 - $463,000
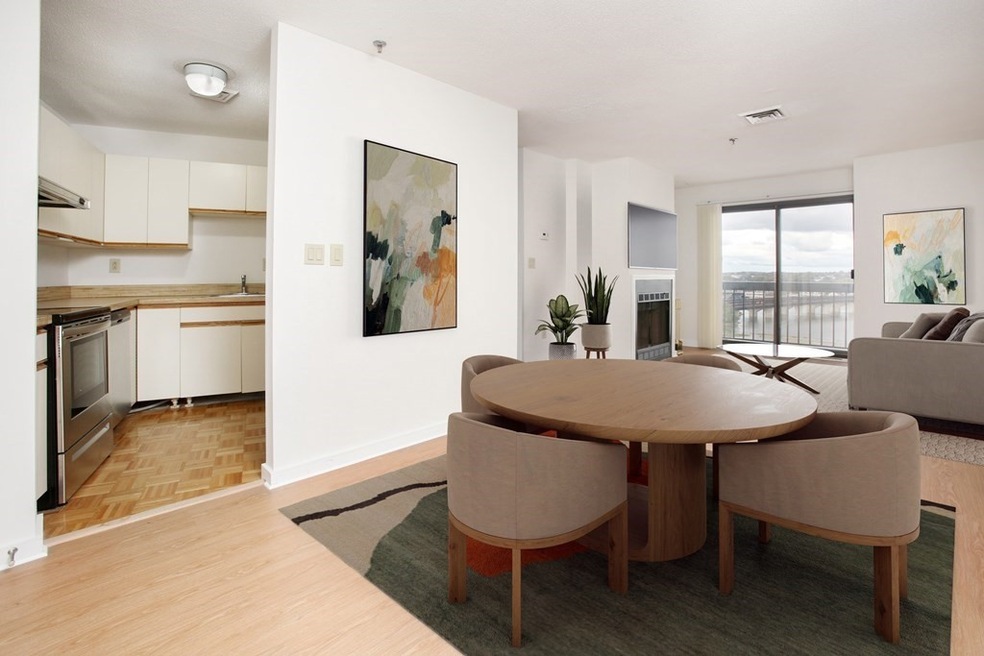
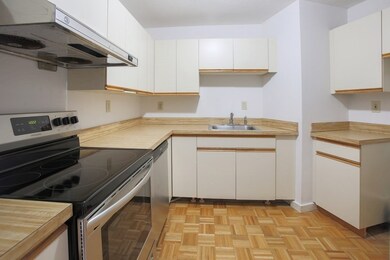
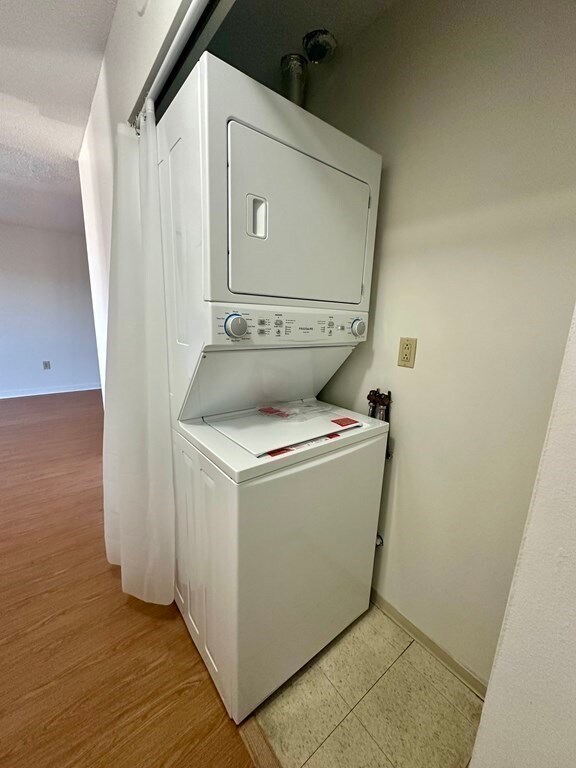
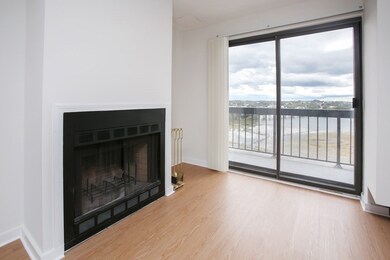
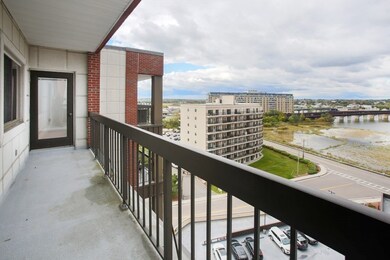
Top-Floor 2-Bedroom 2 Bath Condo with Boston Skyline Views Available for rent: The unit is bright and sunny, equipped with new appliances, including a dishwasher and in unit stackable washer and dryer. Conveniently located minutes from the expressway and North Quincy T station, the condo is central to excellent restaurants, parks, and the beach. It offers garage parking for one car. One-year lease agreement.Owner pays for water. One year lease. Tenant pays electric. First,Last,1/2 month broker fee due from tenant at signing.
| Date | Buyer | Sale Price | Title Company |
|---|---|---|---|
| Mcdonald Carl R | $212,000 | -- | |
| Crossman Glenn A | $132,000 | -- | |
| Moy Dick Y | $90,500 | -- |
| Date | Status | Borrower | Loan Amount |
|---|---|---|---|
| Open | Moy Dick Y | $190,800 | |
| Previous Owner | Moy Dick Y | $100,000 | |
| Previous Owner | Moy Dick Y | $65,000 |
| Date | Event | Price | List to Sale | Price per Sq Ft | Prior Sale |
|---|---|---|---|---|---|
| 01/07/2024 01/07/24 | Rented | $2,300 | 0.0% | -- | |
| 01/01/2024 01/01/24 | Price Changed | $2,300 | -4.2% | $3 / Sq Ft | |
| 12/20/2023 12/20/23 | For Rent | $2,400 | 0.0% | -- | |
| 12/01/2023 12/01/23 | Sold | $387,000 | -3.0% | $448 / Sq Ft | View Prior Sale |
| 11/03/2023 11/03/23 | Pending | -- | -- | -- | |
| 10/18/2023 10/18/23 | For Sale | $399,000 | -- | $462 / Sq Ft |
| Year | Tax Paid | Tax Assessment Tax Assessment Total Assessment is a certain percentage of the fair market value that is determined by local assessors to be the total taxable value of land and additions on the property. | Land | Improvement |
|---|---|---|---|---|
| 2025 | $4,255 | $369,000 | $0 | $369,000 |
| 2024 | $4,124 | $365,900 | $0 | $365,900 |
| 2023 | $3,780 | $339,600 | $0 | $339,600 |
| 2022 | $4,044 | $337,600 | $0 | $337,600 |
| 2021 | $3,983 | $328,100 | $0 | $328,100 |
| 2020 | $4,066 | $327,100 | $0 | $327,100 |
| 2019 | $3,353 | $267,200 | $0 | $267,200 |
| 2018 | $3,543 | $265,600 | $0 | $265,600 |
| 2017 | $3,568 | $251,800 | $0 | $251,800 |
| 2016 | $3,237 | $225,400 | $0 | $225,400 |
| 2015 | $3,275 | $224,300 | $0 | $224,300 |
| 2014 | $3,000 | $201,900 | $0 | $201,900 |
Landlord's Agent in 2024
Colleen Foulsham
FC Realty Group
(857) 939-0144
1 in this area
108 Total Sales
Seller's Agent in 2023
Kevin Caulfield
Compass
(617) 501-3685
2 in this area
168 Total Sales
K
Seller Co-Listing Agent in 2023
Kurt Martell
Compass
(617) 877-2938
1 in this area
24 Total Sales
Source: MLS Property Information Network (MLS PIN)
MLS Number: 73188455
APN: QUIN-006075-000038-000812
Disclaimer: Certain information contained herein is derived from information provided by parties other than Homes.com. All information provided is deemed reliable, but is not guaranteed to be accurate and should be independently verified.
![]() The property listing data and information, or the Images, set forth herein were provided to MLS Property Information Network, Inc. from third party sources, including sellers, lessors and public records, and were compiled by MLS Property Information Network, Inc. The property listing data and information, and the Images, are for the personal, non-commercial use of consumers having a good faith interest in purchasing or leasing listed properties of the type displayed to them and may not be used for any purpose other than to identify prospective properties which such consumers may have a good faith interest in purchasing or leasing. MLS Property Information Network, Inc. and its subscribers disclaim any and all representations and warranties as to the accuracy of the property listing data and information, or as to the accuracy of any of the Images, set forth herein.
The property listing data and information, or the Images, set forth herein were provided to MLS Property Information Network, Inc. from third party sources, including sellers, lessors and public records, and were compiled by MLS Property Information Network, Inc. The property listing data and information, and the Images, are for the personal, non-commercial use of consumers having a good faith interest in purchasing or leasing listed properties of the type displayed to them and may not be used for any purpose other than to identify prospective properties which such consumers may have a good faith interest in purchasing or leasing. MLS Property Information Network, Inc. and its subscribers disclaim any and all representations and warranties as to the accuracy of the property listing data and information, or as to the accuracy of any of the Images, set forth herein.