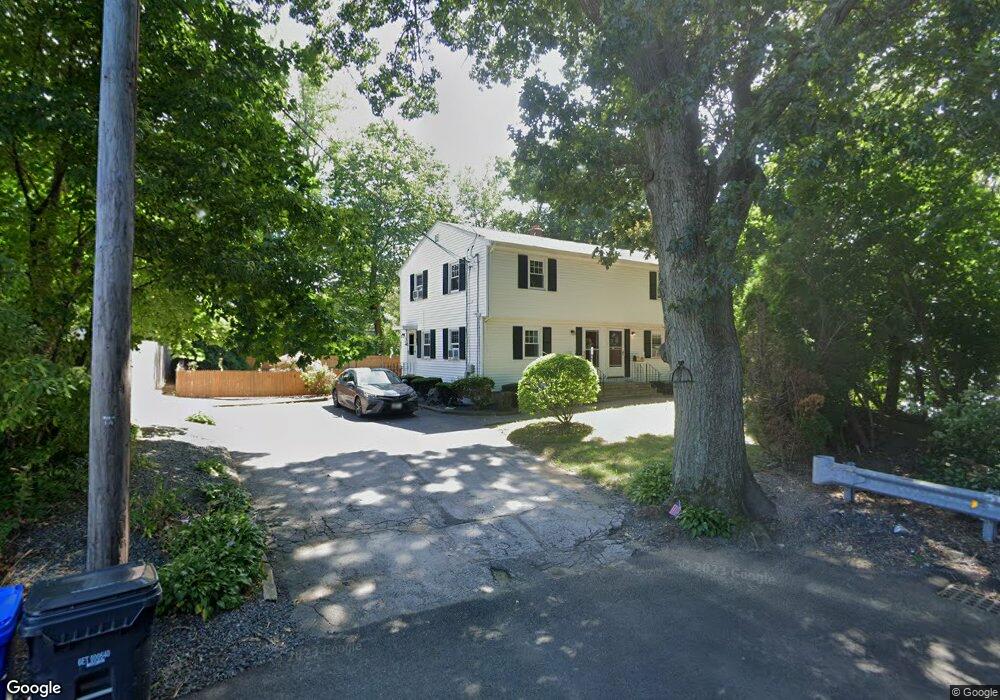
90 Read St Unit 92 Riverside, RI 02915
Riverside NeighborhoodEstimated Value: $514,665 - $583,000
4
Beds
2
Baths
1,000
Sq Ft
$546/Sq Ft
Est. Value
About This Home
This home is located at 90 Read St Unit 92, Riverside, RI 02915 and is currently estimated at $546,416, approximately $546 per square foot. 90 Read St Unit 92 is a home located in Providence County with nearby schools including East Providence High School, St Mary Academy-Bay View, and St Luke Elementary School.
Ownership History
Date
Name
Owned For
Owner Type
Purchase Details
Closed on
Mar 16, 2000
Sold by
Mederios John
Bought by
Vinhateiro Patricia A and Vinhateiro Frederick
Current Estimated Value
Home Financials for this Owner
Home Financials are based on the most recent Mortgage that was taken out on this home.
Original Mortgage
$102,000
Interest Rate
8.24%
Mortgage Type
Purchase Money Mortgage
Create a Home Valuation Report for This Property
The Home Valuation Report is an in-depth analysis detailing your home's value as well as a comparison with similar homes in the area
Home Values in the Area
Average Home Value in this Area
Purchase History
| Date | Buyer | Sale Price | Title Company |
|---|---|---|---|
| Vinhateiro Patricia A | $127,500 | -- | |
| Vinhateiro Patricia A | $127,500 | -- |
Source: Public Records
Mortgage History
| Date | Status | Borrower | Loan Amount |
|---|---|---|---|
| Open | Vinhateiro Patricia A | $175,000 | |
| Closed | Vinhateiro Patricia A | $112,000 | |
| Closed | Vinhateiro Patricia A | $109,000 | |
| Closed | Vinhateiro Patricia A | $102,000 |
Source: Public Records
Tax History
| Year | Tax Paid | Tax Assessment Tax Assessment Total Assessment is a certain percentage of the fair market value that is determined by local assessors to be the total taxable value of land and additions on the property. | Land | Improvement |
|---|---|---|---|---|
| 2025 | $6,565 | $502,300 | $152,200 | $350,100 |
| 2024 | $5,825 | $380,000 | $126,800 | $253,200 |
| 2023 | $5,609 | $380,000 | $126,800 | $253,200 |
| 2022 | $5,555 | $254,100 | $64,700 | $189,400 |
| 2021 | $5,463 | $254,100 | $63,900 | $190,200 |
| 2020 | $5,232 | $254,100 | $63,900 | $190,200 |
| 2019 | $5,087 | $254,100 | $63,900 | $190,200 |
| 2018 | $4,903 | $214,300 | $68,800 | $145,500 |
| 2017 | $4,794 | $214,300 | $68,800 | $145,500 |
| 2016 | $4,770 | $214,300 | $68,800 | $145,500 |
| 2015 | $4,723 | $205,800 | $67,200 | $138,600 |
| 2014 | $4,723 | $205,800 | $67,200 | $138,600 |
Source: Public Records
Map
Nearby Homes
- 99 Allen Ave
- 123 Providence Ave
- 103 Burnside Ave
- 25 Winslow St
- 14 Benedict St
- 33 Pine St Unit 35
- 72 Stowe Ave
- 25 Arnold St
- 15 Claire St
- 10 Booth Ave
- 41 White Ave
- 28 Jefferson Ave
- 151 Willett Ave Unit 2
- 85 Hilton Ave
- 129 Shore Rd
- 15 Plaza Dr
- 0 Carousel Dr
- 43 Bullocks Point Ave Unit 4A
- 25 Bullocks Point Ave Unit 5C
- 33 Bullocks Point Ave Unit 5C
Your Personal Tour Guide
Ask me questions while you tour the home.