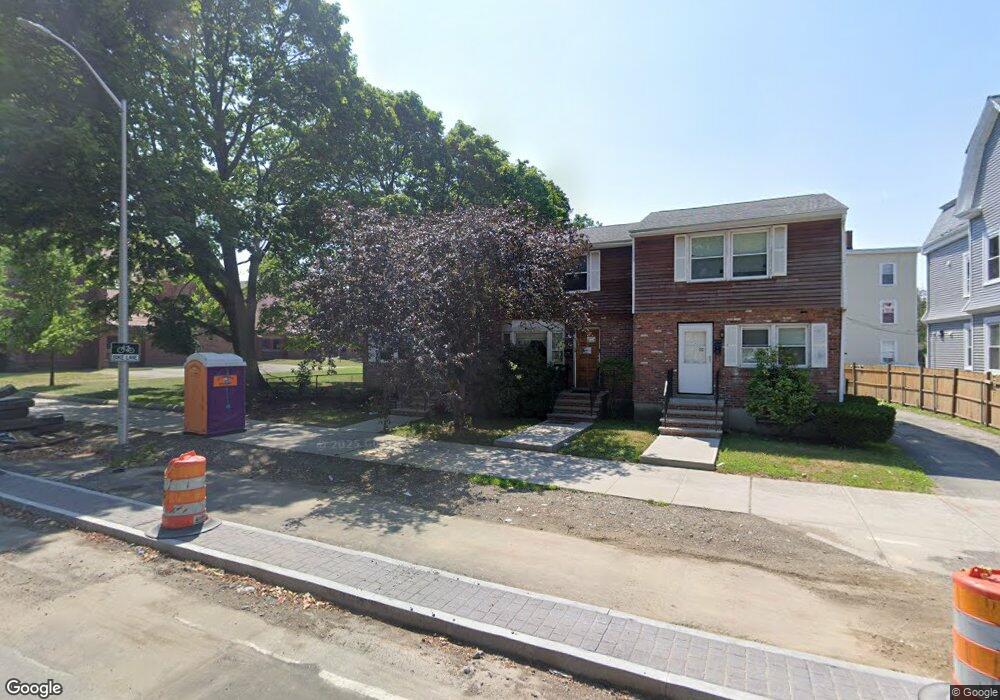
90 S Common St Unit 3 Lynn, MA 01902
Central Lynn NeighborhoodEstimated Value: $280,000 - $282,000
2
Beds
1
Bath
1,192
Sq Ft
$236/Sq Ft
Est. Value
About This Home
This home is located at 90 S Common St Unit 3, Lynn, MA 01902 and is currently estimated at $281,000, approximately $235 per square foot. 90 S Common St Unit 3 is a home located in Essex County with nearby schools including William P Connery Elementary School, William R. Fallon School, and Fecteau-Leary Junior/Senior High School.
Ownership History
Date
Name
Owned For
Owner Type
Purchase Details
Closed on
Mar 5, 2015
Sold by
90 South Common Llc
Bought by
Urban Renewal Llc
Current Estimated Value
Purchase Details
Closed on
Dec 28, 2011
Sold by
Urban Renewal Llc
Bought by
90 South Common Llc
Purchase Details
Closed on
Oct 26, 2011
Sold by
Wells Fargo Bank Na
Bought by
Urban Renewal Llc
Home Financials for this Owner
Home Financials are based on the most recent Mortgage that was taken out on this home.
Original Mortgage
$37,500
Interest Rate
4.11%
Mortgage Type
Purchase Money Mortgage
Purchase Details
Closed on
Feb 27, 2006
Sold by
Syed Saleem and Ali Syed F
Bought by
Dorlus Nicolane
Purchase Details
Closed on
Jul 2, 2003
Sold by
Bears Gary A
Bought by
Ali Syed F
Purchase Details
Closed on
Jun 15, 2001
Sold by
Romano Grace and Romano Giovanni
Bought by
Bears Gary A
Create a Home Valuation Report for This Property
The Home Valuation Report is an in-depth analysis detailing your home's value as well as a comparison with similar homes in the area
Home Values in the Area
Average Home Value in this Area
Purchase History
| Date | Buyer | Sale Price | Title Company |
|---|---|---|---|
| Urban Renewal Llc | -- | -- | |
| Urban Renewal Llc | -- | -- | |
| 90 South Common Llc | -- | -- | |
| 90 South Common Llc | -- | -- | |
| Urban Renewal Llc | $65,100 | -- | |
| Urban Renewal Llc | $65,100 | -- | |
| Dorlus Nicolane | $179,000 | -- | |
| Dorlus Nicolane | $179,000 | -- | |
| Ali Syed F | $154,000 | -- | |
| Ali Syed F | $154,000 | -- | |
| Bears Gary A | $110,000 | -- | |
| Bears Gary A | $110,000 | -- |
Source: Public Records
Mortgage History
| Date | Status | Borrower | Loan Amount |
|---|---|---|---|
| Previous Owner | Bears Gary A | $43,300 | |
| Previous Owner | Bears Gary A | $37,500 |
Source: Public Records
Tax History Compared to Growth
Tax History
| Year | Tax Paid | Tax Assessment Tax Assessment Total Assessment is a certain percentage of the fair market value that is determined by local assessors to be the total taxable value of land and additions on the property. | Land | Improvement |
|---|---|---|---|---|
| 2025 | $1,864 | $179,900 | $0 | $179,900 |
| 2024 | $1,797 | $170,700 | $0 | $170,700 |
| 2023 | $1,636 | $146,700 | $0 | $146,700 |
| 2022 | $1,831 | $147,300 | $0 | $147,300 |
| 2021 | $1,956 | $150,100 | $0 | $150,100 |
| 2020 | $1,782 | $133,000 | $0 | $133,000 |
| 2019 | $1,616 | $113,000 | $0 | $113,000 |
| 2018 | $1,582 | $100,200 | $0 | $100,200 |
| 2017 | $1,566 | $100,400 | $0 | $100,400 |
| 2016 | $1,503 | $92,900 | $0 | $92,900 |
| 2015 | $1,491 | $89,000 | $0 | $89,000 |
Source: Public Records
Map
Nearby Homes
- 50 S Common St Unit 104
- 140 S Common St
- 121 N Common St
- 20 Huss Ct Unit 104
- 20 Huss Ct Unit 105
- 10 Pleasant St Unit 112
- 82 Franklin St
- 23 Franklin St
- 66 Harwood St
- 93 Franklin St
- 57 Johnson St
- 103 Warren St
- 662-664 Western Ave
- 5 Whittier St
- 191-193 Washington St
- 589 Essex St Unit 303
- 58 Laighton St
- 9 Rhodes Ave
- 374-378 Washington St
- 105 Lawton Ave
- 90 S Common St
- 88 S Common St
- 92 S Common St Unit 5
- 92 S Common St Unit 4
- 92 S Common St Unit 3
- 92 S Common St
- 86 S Common St
- 86 S Common St Unit 1
- 96 S Common St
- 12 Van Buren Terrace
- 16 Van Buren Terrace
- 108 S Common St Unit 1R
- 108 S Common St Unit 2L
- 108 S Common St
- 16 Shepard St
- 16 Shepard St Unit 1
- 16 Shepard St Unit 2
- 14 La Grange Terrace Unit 3
- 110 S Common St Unit 3A
- 110 S Common St Unit 112