Estimated Value: $123,000 - $225,000
3
Beds
2
Baths
1,592
Sq Ft
$109/Sq Ft
Est. Value
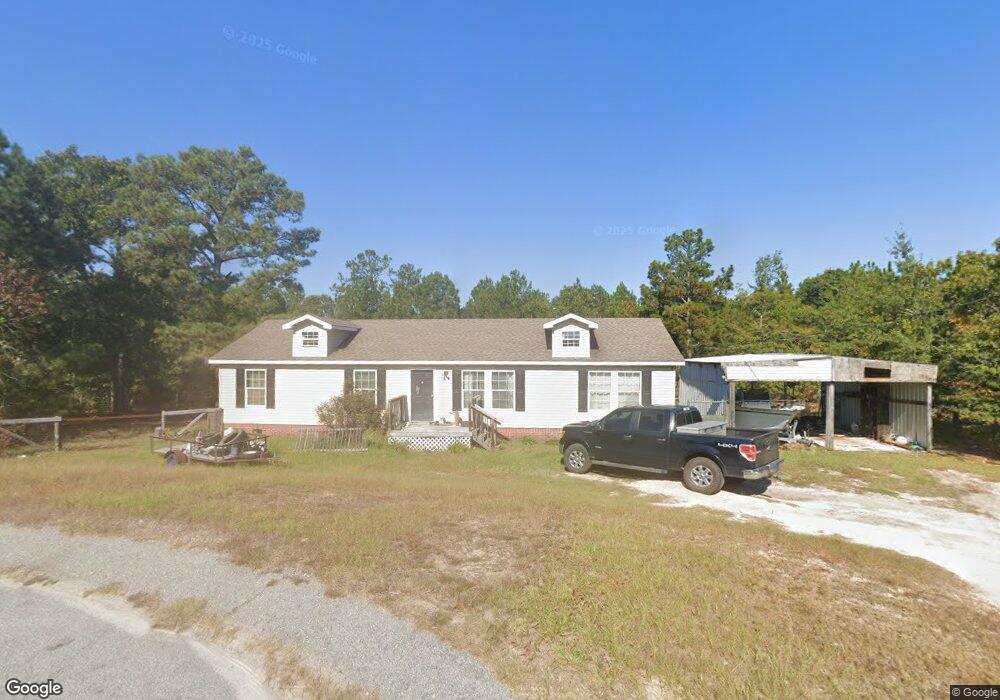
About This Home
This home is located at 90 Silicate Way, Elgin, SC 29045 and is currently estimated at $174,000, approximately $109 per square foot. 90 Silicate Way is a home located in Kershaw County with nearby schools including Blaney Elementary School, Leslie M. Stover Middle School, and Lugoff-Elgin High School.
Ownership History
Date
Name
Owned For
Owner Type
Purchase Details
Closed on
Jan 11, 2021
Sold by
Bc Investments Of Columbia Llc
Bought by
Jay Steven
Current Estimated Value
Home Financials for this Owner
Home Financials are based on the most recent Mortgage that was taken out on this home.
Original Mortgage
$101,010
Outstanding Balance
$89,929
Interest Rate
2.7%
Mortgage Type
New Conventional
Estimated Equity
$84,071
Purchase Details
Closed on
Jan 7, 2021
Sold by
Bc Investments Of Columbia Llc
Bought by
Jay Steven
Home Financials for this Owner
Home Financials are based on the most recent Mortgage that was taken out on this home.
Original Mortgage
$101,010
Outstanding Balance
$89,929
Interest Rate
2.7%
Mortgage Type
New Conventional
Estimated Equity
$84,071
Purchase Details
Closed on
Mar 22, 2011
Sold by
Bank Of Ny Mellon Trust
Bought by
Bc Investments Of Columbia
Purchase Details
Closed on
Sep 22, 2004
Sold by
Champion Homes
Bought by
Bank Of Ny Mellon Trust
Create a Home Valuation Report for This Property
The Home Valuation Report is an in-depth analysis detailing your home's value as well as a comparison with similar homes in the area
Purchase History
| Date | Buyer | Sale Price | Title Company |
|---|---|---|---|
| Jay Steven | $98,000 | Thomas Mark S | |
| Jay Steven | $98,000 | Thomas Mark S | |
| Jay Steven | $98,000 | -- | |
| Bc Investments Of Columbia | $40,000 | -- | |
| Bank Of Ny Mellon Trust | $128,000 | -- |
Source: Public Records
Mortgage History
| Date | Status | Borrower | Loan Amount |
|---|---|---|---|
| Open | Jay Steven | $101,010 | |
| Closed | Jay Steven | $101,010 |
Source: Public Records
Tax History
| Year | Tax Paid | Tax Assessment Tax Assessment Total Assessment is a certain percentage of the fair market value that is determined by local assessors to be the total taxable value of land and additions on the property. | Land | Improvement |
|---|---|---|---|---|
| 2025 | $730 | $98,700 | $13,000 | $85,700 |
| 2024 | $730 | $98,700 | $13,000 | $85,700 |
| 2023 | $910 | $98,700 | $13,000 | $85,700 |
| 2022 | $708 | $98,700 | $13,000 | $85,700 |
| 2021 | $1,947 | $98,700 | $13,000 | $85,700 |
| 2020 | $1,839 | $94,000 | $13,000 | $81,000 |
| 2019 | $1,858 | $94,000 | $13,000 | $81,000 |
| 2018 | $1,802 | $94,000 | $13,000 | $81,000 |
| 2017 | $1,782 | $94,000 | $13,000 | $81,000 |
| 2016 | $566 | $96,700 | $13,000 | $83,700 |
| 2015 | $1,565 | $96,700 | $13,000 | $83,700 |
| 2014 | $1,565 | $0 | $0 | $0 |
Source: Public Records
Map
Nearby Homes
- 1367 Wildwood Ln
- 50 Deer Run
- 50 Rambling Dr
- 1000 Crescent Corner Dr
- 1044 Rocky Branch Ln
- 1026 Oak Branch Ln
- 952 Roberts Dr
- 1351 Smyrna Rd
- 7 Mint Ct
- 1089 Chestnut Hill Rd
- 21 Trumpet View Ln
- 1571 Chestnut Rd
- 347 Smyrna Rd
- 1137 A Smyrna Rd
- 1753 Smyrna Rd
- 1986 Elgin Dr
- 1755 Bookman Rd
- 2206 Highway 1 S
- 517 Watts Hill Rd
- 480 Eskie Dixon Rd
- 84 Silicate Way
- 87 Silicate Way
- 89 Silicate Way
- 78 Silicate Way
- 77 Silicate Way
- 92 Silicate Way
- 73 Silicate Way
- 69 Silicate Way
- 63 Silicate Way
- 54 Silicate Way
- 1076 Veterans Row
- 1076 Veterans Row
- 970B Sessions Rd
- 1325 Chestnut Rd
- 47 Silicate Way
- 1323 Chestnut Rd
- 39 Silicate Way
- 944 Sessions Rd
- 1322 Wildwood Ln
- 1284 Wildwood Ln
Your Personal Tour Guide
Ask me questions while you tour the home.