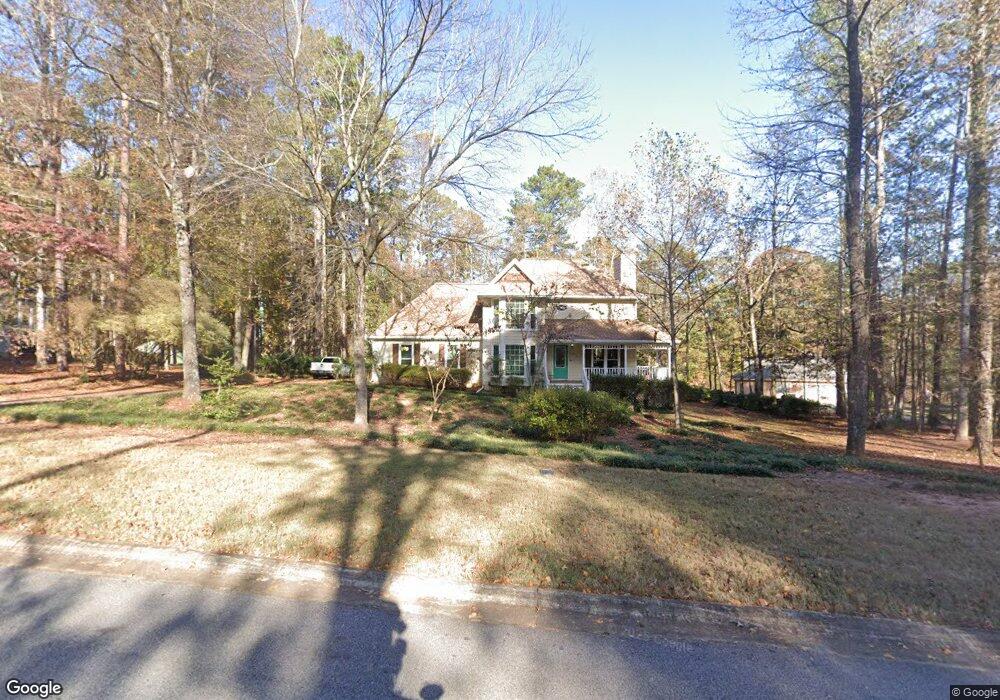
90 Spring Forest Way Sharpsburg, GA 30277
Estimated Value: $389,645 - $416,000
4
Beds
3
Baths
2,328
Sq Ft
$174/Sq Ft
Est. Value
About This Home
This home is located at 90 Spring Forest Way, Sharpsburg, GA 30277 and is currently estimated at $404,161, approximately $173 per square foot. 90 Spring Forest Way is a home located in Coweta County with nearby schools including Thomas Crossroads Elementary School, Lee Middle School, and Northgate High School.
Ownership History
Date
Name
Owned For
Owner Type
Purchase Details
Closed on
Jan 25, 2011
Sold by
Smith Chester L
Bought by
Gentle-Smith Sandra L
Current Estimated Value
Home Financials for this Owner
Home Financials are based on the most recent Mortgage that was taken out on this home.
Original Mortgage
$182,645
Outstanding Balance
$4,248
Interest Rate
4.82%
Mortgage Type
FHA
Estimated Equity
$399,913
Purchase Details
Closed on
Feb 6, 1998
Sold by
Gandy Billy W and Gandy Susan L
Bought by
Kessler Chad and Kessler Andrea
Home Financials for this Owner
Home Financials are based on the most recent Mortgage that was taken out on this home.
Original Mortgage
$290,000
Interest Rate
7.21%
Mortgage Type
New Conventional
Purchase Details
Closed on
Jun 8, 1994
Sold by
Gandy Billy Susan
Bought by
Smith Chester
Purchase Details
Closed on
Dec 7, 1989
Bought by
Gandy Billy W and Gandy S
Create a Home Valuation Report for This Property
The Home Valuation Report is an in-depth analysis detailing your home's value as well as a comparison with similar homes in the area
Home Values in the Area
Average Home Value in this Area
Purchase History
| Date | Buyer | Sale Price | Title Company |
|---|---|---|---|
| Gentle-Smith Sandra L | -- | -- | |
| Kessler Chad | $270,000 | -- | |
| Smith Chester | $147,900 | -- | |
| Gandy Billy W | $105,000 | -- |
Source: Public Records
Mortgage History
| Date | Status | Borrower | Loan Amount |
|---|---|---|---|
| Open | Gentle-Smith Sandra L | $182,645 | |
| Previous Owner | Kessler Chad | $290,000 | |
| Closed | Smith Chester | -- |
Source: Public Records
Tax History Compared to Growth
Tax History
| Year | Tax Paid | Tax Assessment Tax Assessment Total Assessment is a certain percentage of the fair market value that is determined by local assessors to be the total taxable value of land and additions on the property. | Land | Improvement |
|---|---|---|---|---|
| 2025 | $2,035 | $145,814 | $28,000 | $117,814 |
| 2024 | $2,246 | $139,856 | $28,000 | $111,856 |
| 2023 | $2,246 | $139,879 | $28,000 | $111,879 |
| 2022 | $1,700 | $111,368 | $18,000 | $93,368 |
| 2021 | $1,591 | $102,892 | $18,000 | $84,892 |
| 2020 | $1,598 | $102,892 | $18,000 | $84,892 |
| 2019 | $1,473 | $79,272 | $10,000 | $69,272 |
| 2018 | $2,324 | $79,272 | $10,000 | $69,272 |
| 2017 | $2,323 | $79,272 | $10,000 | $69,272 |
| 2016 | $1,975 | $68,212 | $10,000 | $58,212 |
| 2015 | $1,859 | $65,302 | $10,000 | $55,302 |
| 2014 | $1,680 | $65,302 | $10,000 | $55,302 |
Source: Public Records
Map
Nearby Homes
- Spring Forest Way Lot: 2-1
- 0 Spring Forest Way Unit LOT 2-1 10483749
- 3771 Highway 34 E Unit TRACT2
- 3771 Highway 34 E Unit TRACT1
- 20 Platinum Ridge
- 185 Grand Jct
- 90 Spring Forest Trail
- 5 Timber Walk Place
- 160 Old Field Rd
- 165 Bartlett Dr
- 160 Maple Leaf Rd
- 150 Park Timbers Dr
- 85 Holly Springs Rd
- 0 Pinegate Way Unit 10436279
- 435 Mapledale Trail
- 30 Creekwood Dr
- 2462 Sharpsburg McCullum Rd
- 430 Mapledale Trail
- 185 Mapledale Trail
- 374 Beaumont Farms Dr
- 80 Spring Forest Way
- 110 Spring Forest Way
- 170 Spring Forest Way
- 75 Spring Forest Way
- 85 Spring Forest Way
- 95 Spring Forest Way
- 70 Spring Forest Way
- 150 Spring Forest Way
- 115 Spring Forest Way
- 60 Spring Forest Way
- 180 Spring Forest Way
- 45 Spring Forest Way
- 125 Spring Forest Way
- 15 Spring Forest Way
- 190 Spring Forest Way
- 3960 Highway 34 E
- 135 Spring Forest Way
- 3748 Hwy 34 E
- 0 Spring Forest
- 165 Spring Forest Way