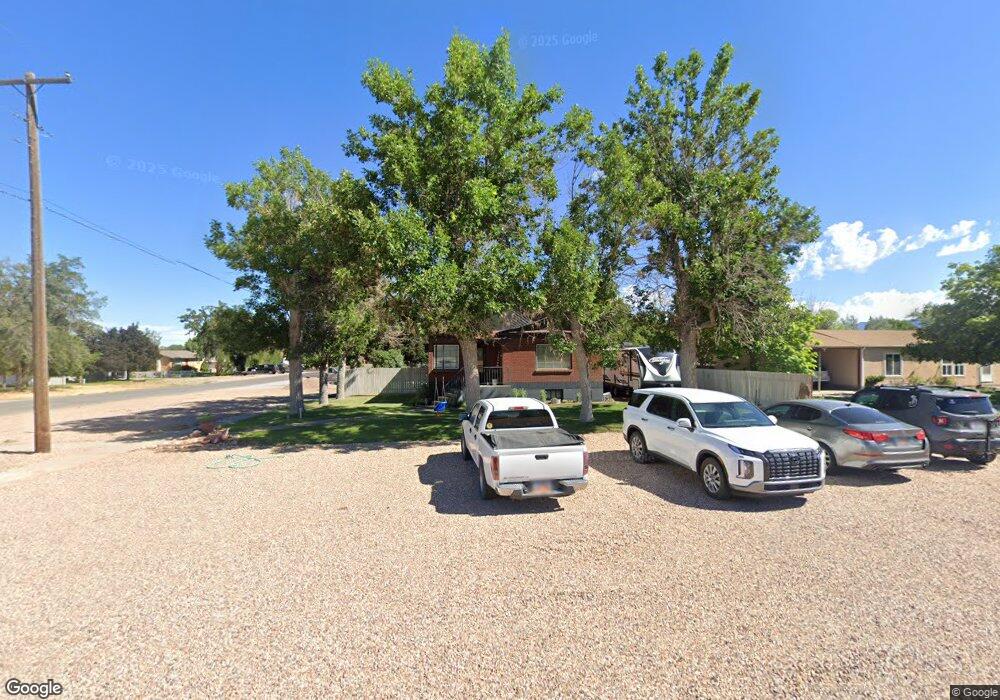
90 W 300 N Fillmore, UT 84631
Estimated Value: $254,000 - $481,000
3
Beds
1
Bath
1,620
Sq Ft
$195/Sq Ft
Est. Value
About This Home
This home is located at 90 W 300 N, Fillmore, UT 84631 and is currently estimated at $316,531, approximately $195 per square foot. 90 W 300 N is a home located in Millard County.
Ownership History
Date
Name
Owned For
Owner Type
Purchase Details
Closed on
Feb 19, 2021
Sold by
Burnham Dashell
Bought by
Markward Corbin and Markward Shianna
Current Estimated Value
Home Financials for this Owner
Home Financials are based on the most recent Mortgage that was taken out on this home.
Original Mortgage
$171,830
Outstanding Balance
$153,332
Interest Rate
2.7%
Mortgage Type
FHA
Estimated Equity
$163,199
Purchase Details
Closed on
May 23, 2018
Sold by
Chappell Thomas Drake
Bought by
Burnham Deshell
Home Financials for this Owner
Home Financials are based on the most recent Mortgage that was taken out on this home.
Original Mortgage
$123,232
Interest Rate
4.4%
Mortgage Type
New Conventional
Purchase Details
Closed on
Jun 10, 2005
Sold by
Bergener Brent
Bought by
Whitaker Dennis C and Whitaker Carol M
Create a Home Valuation Report for This Property
The Home Valuation Report is an in-depth analysis detailing your home's value as well as a comparison with similar homes in the area
Home Values in the Area
Average Home Value in this Area
Purchase History
| Date | Buyer | Sale Price | Title Company |
|---|---|---|---|
| Markward Corbin | -- | First American Title | |
| Burnham Deshell | -- | First American Title | |
| Whitaker Dennis C | -- | First American Title Insuran |
Source: Public Records
Mortgage History
| Date | Status | Borrower | Loan Amount |
|---|---|---|---|
| Open | Markward Corbin | $171,830 | |
| Previous Owner | Burnham Deshell | $123,232 |
Source: Public Records
Tax History Compared to Growth
Tax History
| Year | Tax Paid | Tax Assessment Tax Assessment Total Assessment is a certain percentage of the fair market value that is determined by local assessors to be the total taxable value of land and additions on the property. | Land | Improvement |
|---|---|---|---|---|
| 2025 | $915 | $114,924 | $20,098 | $94,826 |
| 2024 | $915 | $106,382 | $20,292 | $86,090 |
| 2023 | $1,185 | $106,382 | $20,292 | $86,090 |
| 2022 | $998 | $89,641 | $18,448 | $71,193 |
| 2021 | $826 | $71,190 | $11,979 | $59,211 |
| 2020 | $764 | $66,261 | $10,890 | $55,371 |
| 2019 | $655 | $56,999 | $10,890 | $46,109 |
| 2018 | $583 | $51,924 | $10,890 | $41,034 |
| 2017 | $536 | $45,332 | $10,890 | $34,442 |
| 2016 | $512 | $45,332 | $10,890 | $34,442 |
| 2015 | $512 | $45,332 | $10,890 | $34,442 |
| 2014 | -- | $45,332 | $10,890 | $34,442 |
| 2013 | -- | $45,332 | $10,890 | $34,442 |
Source: Public Records
Map
Nearby Homes
- 295 N 100 West St
- 390 N 100 W
- 380 N 200 St W
- 165 N 100 W
- 225 W 200 St N
- 75 N 100 West St
- 335 W 400 North St
- 40 S 100 Rd E
- 120 S 100 East Rd
- 410 W 400 N
- 220 S 200 E
- 190 W 400 St S
- 310 S 500 West Rd
- 430 E Canyon Rd
- 155 E 500 St S
- 157 E 500 South St
- 2155 N Cedar Mountain Rd
- 2835 N Cedar Mountain Rd
- 310 S 600 E
- 405 E 500 St S