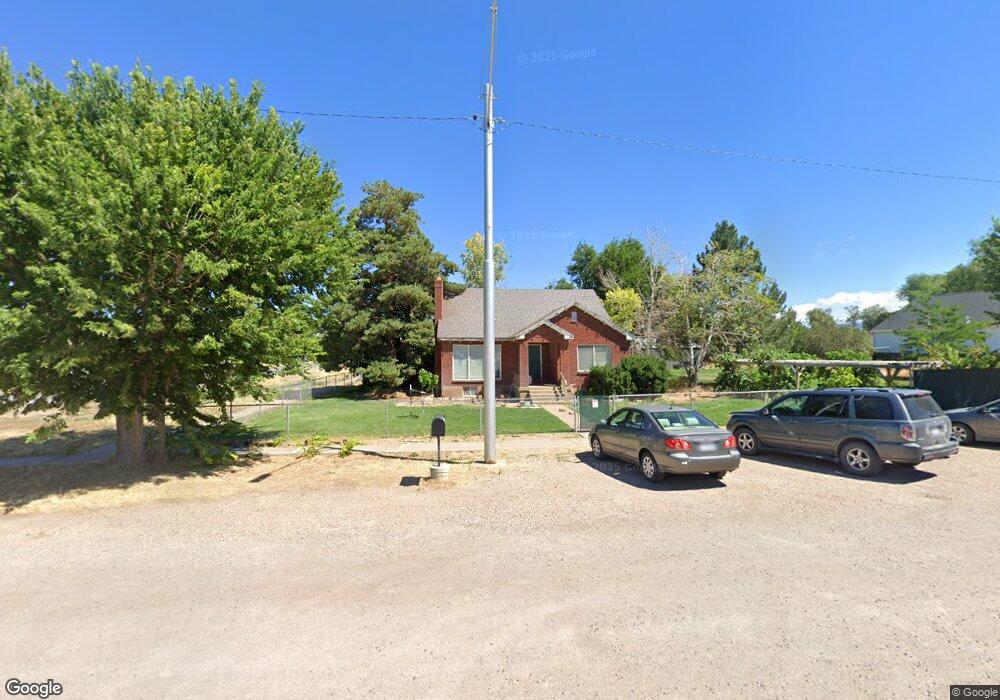
90 W 500 S Fillmore, UT 84631
Estimated Value: $342,000 - $472,000
6
Beds
3
Baths
3,622
Sq Ft
$115/Sq Ft
Est. Value
About This Home
This home is located at 90 W 500 S, Fillmore, UT 84631 and is currently estimated at $418,141, approximately $115 per square foot. 90 W 500 S is a home located in Millard County.
Ownership History
Date
Name
Owned For
Owner Type
Purchase Details
Closed on
Feb 6, 2020
Sold by
Sperry Todd Lamont
Bought by
Larsen Jaren A and Sperry Katherine
Current Estimated Value
Purchase Details
Closed on
Jul 7, 2017
Home Financials for this Owner
Home Financials are based on the most recent Mortgage that was taken out on this home.
Original Mortgage
$188,100
Interest Rate
4.02%
Mortgage Type
New Conventional
Purchase Details
Closed on
Jun 16, 2017
Sold by
Alldredge Tyler and Alldredge Cola
Bought by
Larsen Jaren A and Larsen Katherine
Home Financials for this Owner
Home Financials are based on the most recent Mortgage that was taken out on this home.
Original Mortgage
$188,100
Interest Rate
4.02%
Mortgage Type
New Conventional
Purchase Details
Closed on
Oct 24, 2008
Sold by
Doine Ray F
Bought by
Doine Ray F
Purchase Details
Closed on
Sep 19, 2008
Sold by
Bowles Clint and Bowles Clint Chad
Bought by
Doine Ray F
Create a Home Valuation Report for This Property
The Home Valuation Report is an in-depth analysis detailing your home's value as well as a comparison with similar homes in the area
Home Values in the Area
Average Home Value in this Area
Purchase History
| Date | Buyer | Sale Price | Title Company |
|---|---|---|---|
| Larsen Jaren A | -- | First American Title | |
| -- | -- | -- | |
| Larsen Jaren A | -- | First American Title | |
| Doine Ray F | -- | -- | |
| Doine Ray F | -- | -- |
Source: Public Records
Mortgage History
| Date | Status | Borrower | Loan Amount |
|---|---|---|---|
| Previous Owner | Larsen Jaren A | $188,100 |
Source: Public Records
Tax History Compared to Growth
Tax History
| Year | Tax Paid | Tax Assessment Tax Assessment Total Assessment is a certain percentage of the fair market value that is determined by local assessors to be the total taxable value of land and additions on the property. | Land | Improvement |
|---|---|---|---|---|
| 2025 | $1,971 | $247,603 | $20,748 | $226,855 |
| 2024 | $1,971 | $226,137 | $20,292 | $205,845 |
| 2023 | $2,420 | $226,137 | $20,292 | $205,845 |
| 2022 | $1,986 | $178,352 | $18,448 | $159,904 |
| 2021 | $1,668 | $143,826 | $11,979 | $131,847 |
| 2020 | $1,547 | $134,185 | $10,890 | $123,295 |
| 2019 | $1,306 | $113,561 | $10,890 | $102,671 |
| 2018 | $1,243 | $110,666 | $10,890 | $99,776 |
| 2017 | $1,073 | $90,852 | $10,890 | $79,962 |
| 2016 | $1,027 | $90,852 | $10,890 | $79,962 |
| 2015 | $1,027 | $90,852 | $10,890 | $79,962 |
| 2014 | -- | $75,269 | $10,890 | $64,379 |
| 2013 | -- | $75,269 | $10,890 | $64,379 |
Source: Public Records
Map
Nearby Homes
- 190 W 400 St S
- 155 E 500 St S
- 157 E 500 South St
- 220 S 200 E
- 405 E 500 St S
- 310 S 500 West Rd
- 40 S 100 Rd E
- 760 E 700 St S
- 430 E Canyon Rd
- 75 N 100 West St
- 310 S 600 E
- 165 N 100 W
- 690 E 500 S
- 225 W 200 St N
- 295 N 100 West St
- 1100 S 725 Rd W
- 750 800 South Fillmore
- 825 800 South Fillmore
- 800 800 South Fillmore
- 390 N 100 W