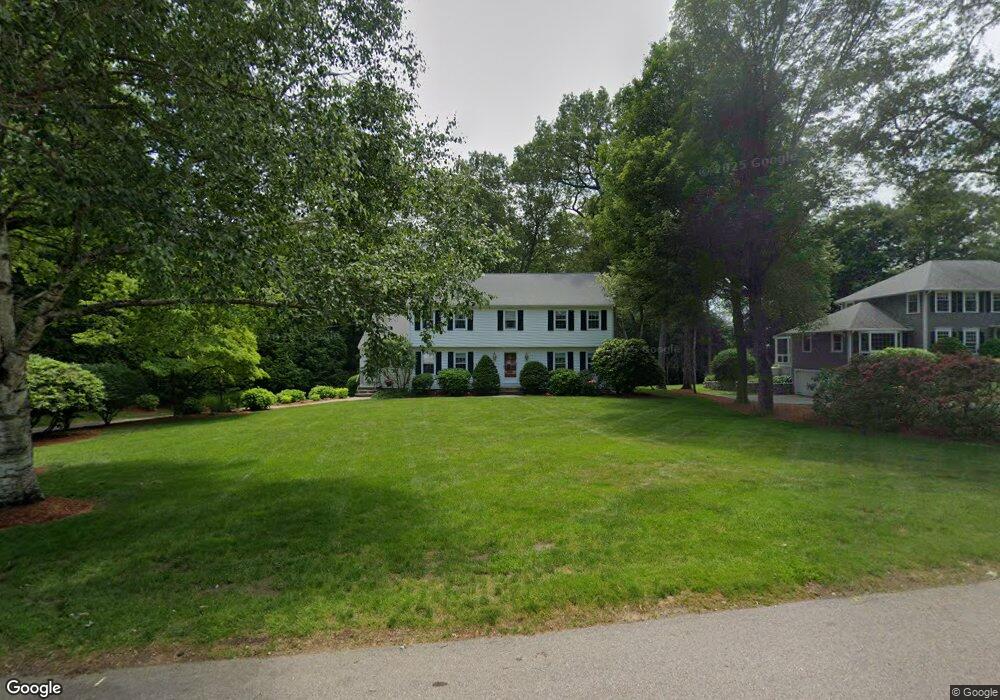
90 Wagon Rd Westwood, MA 02090
Estimated Value: $1,461,134 - $1,699,000
4
Beds
3
Baths
2,789
Sq Ft
$559/Sq Ft
Est. Value
About This Home
This home is located at 90 Wagon Rd, Westwood, MA 02090 and is currently estimated at $1,559,534, approximately $559 per square foot. 90 Wagon Rd is a home located in Norfolk County with nearby schools including Westwood High School, St Catherine Of Siena School, and Xaverian Brothers High School.
Ownership History
Date
Name
Owned For
Owner Type
Purchase Details
Closed on
Jul 7, 2025
Sold by
Mcelrou Ft and Mcelroy
Bought by
Sandra R Mcelroy Ret and Mcelroy
Current Estimated Value
Purchase Details
Closed on
Jan 25, 2023
Sold by
Mcelroy Peter M and Mcelroy Sandra K
Bought by
Mcelroy Ft and Mcelroy
Purchase Details
Closed on
Jun 23, 1997
Sold by
White Peter T and White Joan A
Bought by
Mcelroy Peter M and Mcelroy Sandra K
Purchase Details
Closed on
Apr 15, 1987
Sold by
Johnson Larry A
Bought by
White Peter T
Create a Home Valuation Report for This Property
The Home Valuation Report is an in-depth analysis detailing your home's value as well as a comparison with similar homes in the area
Home Values in the Area
Average Home Value in this Area
Purchase History
| Date | Buyer | Sale Price | Title Company |
|---|---|---|---|
| Sandra R Mcelroy Ret | -- | -- | |
| Sandra R Mcelroy Ret | -- | -- | |
| Mcelroy Ft | -- | None Available | |
| Mcelroy Ft | -- | None Available | |
| Mcelroy Peter M | $457,000 | -- | |
| Mcelroy Peter M | $457,000 | -- | |
| White Peter T | $395,000 | -- |
Source: Public Records
Mortgage History
| Date | Status | Borrower | Loan Amount |
|---|---|---|---|
| Previous Owner | White Peter T | $230,000 | |
| Previous Owner | White Peter T | $214,000 |
Source: Public Records
Tax History Compared to Growth
Tax History
| Year | Tax Paid | Tax Assessment Tax Assessment Total Assessment is a certain percentage of the fair market value that is determined by local assessors to be the total taxable value of land and additions on the property. | Land | Improvement |
|---|---|---|---|---|
| 2025 | $16,891 | $1,319,600 | $686,800 | $632,800 |
| 2024 | $16,553 | $1,292,200 | $654,000 | $638,200 |
| 2023 | $14,836 | $1,037,500 | $545,200 | $492,300 |
| 2022 | $13,766 | $928,250 | $461,200 | $467,050 |
| 2021 | $13,643 | $923,100 | $439,200 | $483,900 |
| 2020 | $13,160 | $906,950 | $439,200 | $467,750 |
| 2019 | $12,573 | $858,200 | $418,000 | $440,200 |
| 2018 | $12,556 | $832,050 | $418,000 | $414,050 |
| 2017 | $11,998 | $823,450 | $418,000 | $405,450 |
| 2016 | $11,673 | $796,250 | $418,000 | $378,250 |
| 2015 | $11,262 | $738,950 | $418,000 | $320,950 |
Source: Public Records
Map
Nearby Homes