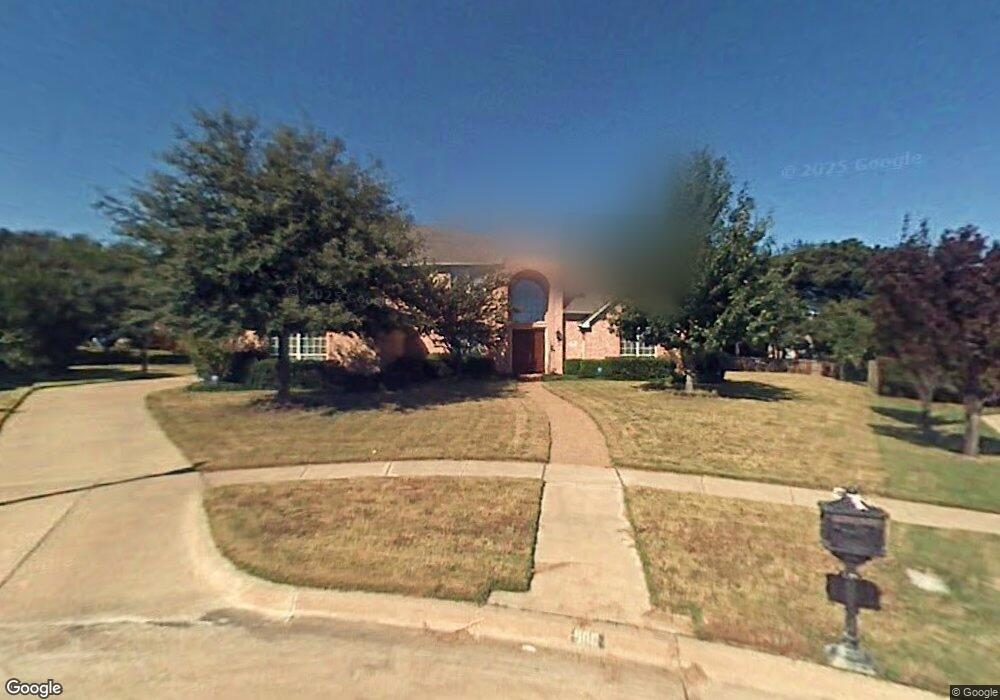
900 Canterbury Ct Southlake, TX 76092
Estimated Value: $1,159,280 - $1,256,000
5
Beds
4
Baths
4,300
Sq Ft
$283/Sq Ft
Est. Value
About This Home
This home is located at 900 Canterbury Ct, Southlake, TX 76092 and is currently estimated at $1,218,570, approximately $283 per square foot. 900 Canterbury Ct is a home located in Tarrant County with nearby schools including Carroll Elementary School, Eubanks Intermediate School, and George Dawson Middle School.
Ownership History
Date
Name
Owned For
Owner Type
Purchase Details
Closed on
Aug 30, 2019
Sold by
Dahl Thomas S and Dahl Susan M
Bought by
Dahl Thomas Scott and Dahl Susan Marie
Current Estimated Value
Purchase Details
Closed on
Jul 15, 2002
Sold by
Heinle Jeffrey Stephen and Heinle Sheila
Bought by
Dahl Thomas S and Dahl Susan M
Home Financials for this Owner
Home Financials are based on the most recent Mortgage that was taken out on this home.
Original Mortgage
$150,000
Interest Rate
6.73%
Purchase Details
Closed on
Jun 25, 1996
Sold by
Weekley Homes Inc
Bought by
Heinle Jeffrey Stephen and Heinle Sheila Kim
Home Financials for this Owner
Home Financials are based on the most recent Mortgage that was taken out on this home.
Original Mortgage
$278,400
Interest Rate
8.1%
Create a Home Valuation Report for This Property
The Home Valuation Report is an in-depth analysis detailing your home's value as well as a comparison with similar homes in the area
Home Values in the Area
Average Home Value in this Area
Purchase History
| Date | Buyer | Sale Price | Title Company |
|---|---|---|---|
| Dahl Thomas Scott | -- | None Available | |
| Dahl Thomas S | -- | Alamo Title Company | |
| Heinle Jeffrey Stephen | -- | Stewart Title |
Source: Public Records
Mortgage History
| Date | Status | Borrower | Loan Amount |
|---|---|---|---|
| Closed | Dahl Thomas S | $150,000 | |
| Previous Owner | Heinle Jeffrey Stephen | $278,400 |
Source: Public Records
Tax History Compared to Growth
Tax History
| Year | Tax Paid | Tax Assessment Tax Assessment Total Assessment is a certain percentage of the fair market value that is determined by local assessors to be the total taxable value of land and additions on the property. | Land | Improvement |
|---|---|---|---|---|
| 2025 | $10,569 | $948,825 | $354,225 | $594,600 |
| 2024 | $10,569 | $997,695 | $354,225 | $643,470 |
| 2023 | $14,075 | $1,086,604 | $354,225 | $732,379 |
| 2022 | $15,145 | $702,000 | $236,150 | $465,850 |
| 2021 | $16,006 | $702,000 | $236,150 | $465,850 |
| 2020 | $16,326 | $741,258 | $212,535 | $528,723 |
| 2019 | $15,636 | $645,700 | $150,000 | $495,700 |
| 2018 | $14,044 | $617,000 | $150,000 | $467,000 |
| 2017 | $14,624 | $590,000 | $132,000 | $458,000 |
| 2016 | $14,420 | $581,785 | $132,000 | $449,785 |
| 2015 | $12,156 | $531,607 | $108,000 | $423,607 |
| 2014 | $12,156 | $530,500 | $66,000 | $464,500 |
Source: Public Records
Map
Nearby Homes
- 608 Stratford Dr
- 1002 Chimney Hill Trail
- 305 Sheffield Dr
- 690 S Peytonville Ave
- 203 Manor Place
- 710 Deer Hollow Blvd
- 806 Shadow Glen Dr
- 1196 W Continental Blvd
- 800 Woodcrest Ct
- 806 Ridgedale Ct
- 1206 Oakwood Trail
- 503 Indian Paintbrush Way
- 2530 & 2580 W Southlake Blvd
- 1212 Oakwood Trail
- 945 Deer Hollow Blvd
- 1205 Scenic Dr
- 900 Kingsbury Way
- 204 Southridge Lakes Pkwy
- 1010 Deer Hollow Blvd
- 102 Springbrook Ct
- 902 Canterbury Ct
- 901 Canterbury Ct
- 1421 Brighton Ct
- 1423 Brighton Ct
- 1419 Brighton Ct
- 904 Canterbury Ct
- 903 Canterbury Ct
- 1425 Brighton Ct
- 901 Dowling Ct
- 900 Bristol Ct
- 1417 Brighton Ct
- 903 Dowling Ct
- 902 Bristol Ct
- 1424 Brighton Ct
- 905 Canterbury Ct
- 1424 Dartmouth Dr
- 1420 Brighton Ct
- 900 Dowling Ct
- 1406 Dartmouth Dr
- 1415 Brighton Ct