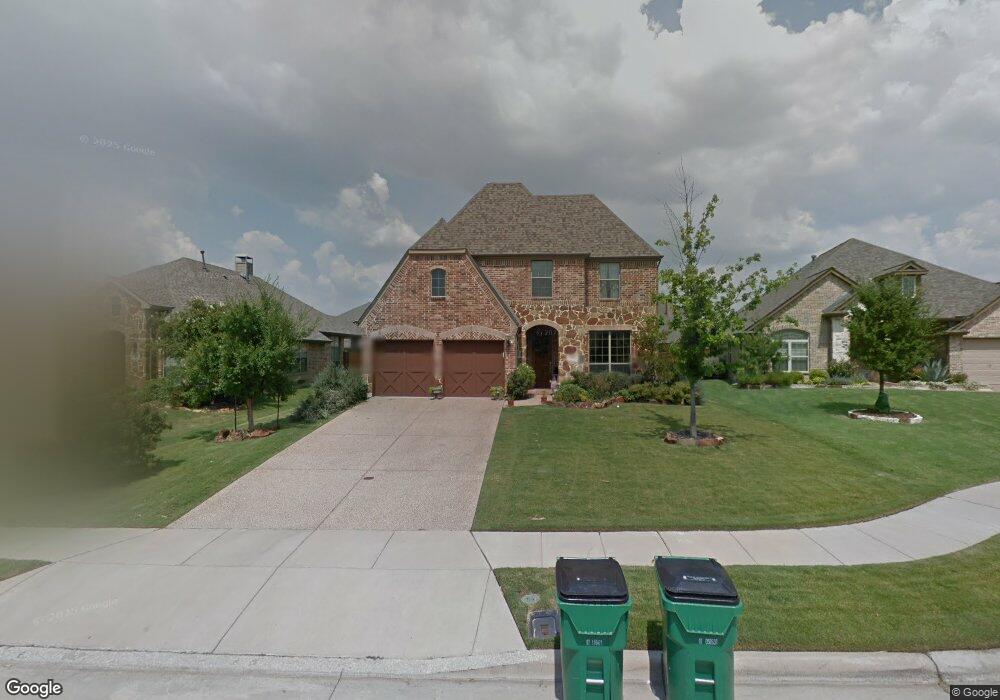
900 Fox Ridge Trail Unit L Prosper, TX 75078
Estimated Value: $631,000 - $728,000
4
Beds
3
Baths
2,860
Sq Ft
$232/Sq Ft
Est. Value
About This Home
This home is located at 900 Fox Ridge Trail Unit L, Prosper, TX 75078 and is currently estimated at $662,581, approximately $231 per square foot. 900 Fox Ridge Trail Unit L is a home located in Collin County with nearby schools including Ralph and Mary Lynn Boyer Elementary School, Reynolds Middle School, and Prosper High School.
Ownership History
Date
Name
Owned For
Owner Type
Purchase Details
Closed on
May 25, 2023
Sold by
Federal National Mortgage Association
Bought by
Schell Mitzi
Current Estimated Value
Purchase Details
Closed on
May 22, 2023
Sold by
Federal National Mortgage Association
Bought by
Schell Mitzi
Purchase Details
Closed on
Oct 18, 2019
Sold by
Wells Fargo Bank Na
Bought by
Fannie Mae and Federal National Mortgage Association
Purchase Details
Closed on
Oct 1, 2019
Sold by
Hughes Christopher
Bought by
Wells Fargo Bank Na
Purchase Details
Closed on
Feb 17, 2017
Sold by
Harpole Jeremy D and Harpole Michelle S
Bought by
Hughes Christopher
Home Financials for this Owner
Home Financials are based on the most recent Mortgage that was taken out on this home.
Original Mortgage
$411,350
Interest Rate
4.09%
Purchase Details
Closed on
Jul 30, 2007
Sold by
Highland Homes Ltd
Bought by
Harpole Jeremy D and Harpole Michelle S
Home Financials for this Owner
Home Financials are based on the most recent Mortgage that was taken out on this home.
Original Mortgage
$256,600
Interest Rate
6.73%
Create a Home Valuation Report for This Property
The Home Valuation Report is an in-depth analysis detailing your home's value as well as a comparison with similar homes in the area
Home Values in the Area
Average Home Value in this Area
Purchase History
| Date | Buyer | Sale Price | Title Company |
|---|---|---|---|
| Schell Mitzi | -- | Simplifile | |
| Schell Mitzi | -- | Simplifile | |
| Fannie Mae | -- | None Available | |
| Wells Fargo Bank Na | $386,200 | None Available | |
| Hughes Christopher | -- | Lawyers Title | |
| Harpole Jeremy D | -- | Rtc |
Source: Public Records
Mortgage History
| Date | Status | Borrower | Loan Amount |
|---|---|---|---|
| Previous Owner | Hughes Christopher | $411,350 | |
| Previous Owner | Harpole Jeremy D | $256,600 |
Source: Public Records
Tax History
| Year | Tax Paid | Tax Assessment Tax Assessment Total Assessment is a certain percentage of the fair market value that is determined by local assessors to be the total taxable value of land and additions on the property. | Land | Improvement |
|---|---|---|---|---|
| 2025 | $10,928 | $624,422 | $190,000 | $434,422 |
| 2024 | $10,928 | $648,520 | $180,000 | $468,520 |
| 2023 | $10,928 | $617,949 | $180,000 | $437,949 |
| 2022 | $11,848 | $541,876 | $140,000 | $401,876 |
| 2021 | $9,234 | $415,998 | $105,000 | $310,998 |
| 2020 | $9,353 | $398,931 | $100,000 | $298,931 |
| 2019 | $10,026 | $408,890 | $100,000 | $308,890 |
| 2018 | $9,884 | $401,456 | $100,000 | $301,456 |
| 2017 | $9,877 | $401,188 | $100,000 | $301,188 |
| 2016 | $9,202 | $371,087 | $75,000 | $296,087 |
| 2015 | $7,265 | $347,669 | $75,000 | $272,669 |
Source: Public Records
Map
Nearby Homes
- 941 Fox Ridge Trail
- 1541 Havenbrook Ln
- 920 Sabine Dr
- 870 Sabine Dr
- 721 Berkshire Dr
- 990 Waterview Dr
- 431 Fawn Mist Dr
- 411 Fox Crossing Ln
- 1120 Golden Sunset Ct
- 520 Devonshire Dr
- 341 Evening Sun Dr
- 1630 Old Oak
- 140 Godstone Ln
- 1530 Binkley Ave
- 1570 Binkley Ave
- 1580 Binkley Ave
- 4420 Mockingbird Ln
- 4417 Fall Meadow Dr
- 2008 Montgomery Ln
- 221 Saint Mark Ln
- 900 Fox Ridge Trail
- 910 Fox Ridge Trail
- 880 Fox Ridge Trail
- 920 Fox Ridge Trail
- 901 Tumbleweed Dr
- 911 Tumbleweed Dr
- 891 Tumbleweed Dr
- 870 Fox Ridge Trail
- 921 Tumbleweed Dr
- 930 Fox Ridge Trail
- 881 Tumbleweed Dr
- 901 Fox Ridge Trail
- 861 Fox Ridge Trail
- 860 Fox Ridge Trail
- 911 Fox Ridge Trail
- 931 Tumbleweed Dr
- 871 Tumbleweed Dr
- 940 Fox Ridge Trail
- 921 Fox Ridge Trail
- 941 Tumbleweed Dr
Your Personal Tour Guide
Ask me questions while you tour the home.