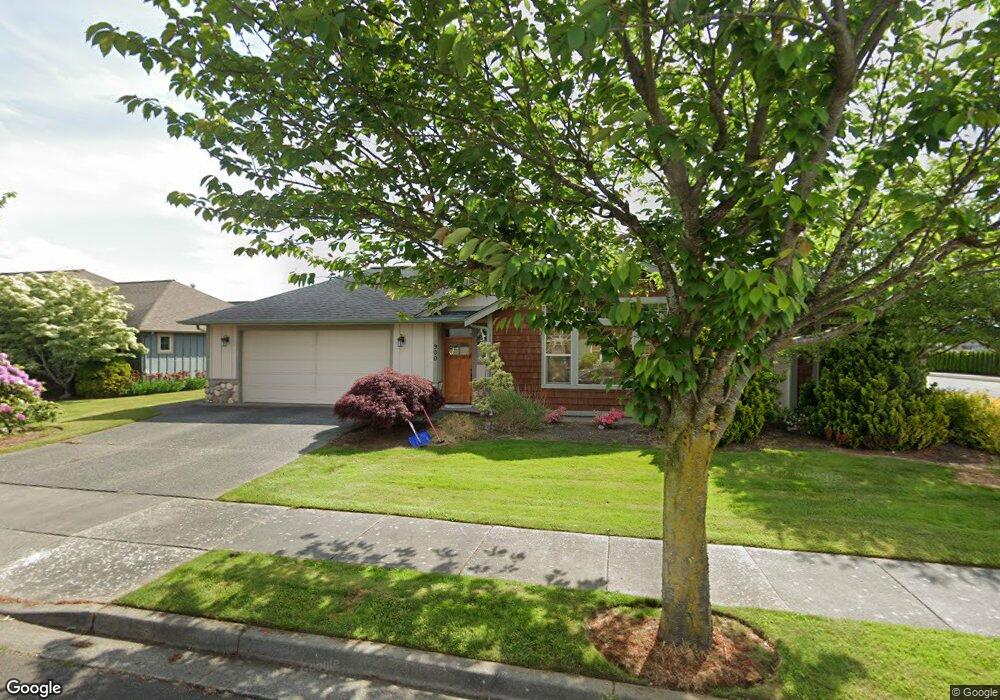
900 Hemlock Loop Lynden, WA 98264
Estimated Value: $644,000 - $710,000
3
Beds
2
Baths
1,854
Sq Ft
$369/Sq Ft
Est. Value
About This Home
This home is located at 900 Hemlock Loop, Lynden, WA 98264 and is currently estimated at $683,711, approximately $368 per square foot. 900 Hemlock Loop is a home located in Whatcom County with nearby schools including Lynden High School, Lynden Christian School, and Lynden Christian Schools: Administration.
Ownership History
Date
Name
Owned For
Owner Type
Purchase Details
Closed on
Mar 24, 2010
Sold by
Howze Howard E and Howze Terri L
Bought by
Haas Bruce F and Haas Brenda G
Current Estimated Value
Home Financials for this Owner
Home Financials are based on the most recent Mortgage that was taken out on this home.
Original Mortgage
$260,000
Outstanding Balance
$170,022
Interest Rate
4.95%
Mortgage Type
New Conventional
Estimated Equity
$513,689
Purchase Details
Closed on
Sep 11, 2007
Sold by
Williamson Daniel G and Williamson Teresa
Bought by
Howze Howard E and Howze Terri L
Home Financials for this Owner
Home Financials are based on the most recent Mortgage that was taken out on this home.
Original Mortgage
$150,000
Interest Rate
6.67%
Mortgage Type
Purchase Money Mortgage
Create a Home Valuation Report for This Property
The Home Valuation Report is an in-depth analysis detailing your home's value as well as a comparison with similar homes in the area
Home Values in the Area
Average Home Value in this Area
Purchase History
| Date | Buyer | Sale Price | Title Company |
|---|---|---|---|
| Haas Bruce F | $325,280 | Chicago Title Insurance | |
| Howze Howard E | $351,980 | Chicago Title Insurance |
Source: Public Records
Mortgage History
| Date | Status | Borrower | Loan Amount |
|---|---|---|---|
| Open | Haas Bruce F | $260,000 | |
| Previous Owner | Howze Howard E | $150,000 |
Source: Public Records
Tax History
| Year | Tax Paid | Tax Assessment Tax Assessment Total Assessment is a certain percentage of the fair market value that is determined by local assessors to be the total taxable value of land and additions on the property. | Land | Improvement |
|---|---|---|---|---|
| 2025 | $4,920 | $667,626 | $272,825 | $394,801 |
| 2024 | $4,606 | $649,511 | $242,500 | $407,011 |
| 2023 | $4,606 | $641,357 | $250,000 | $391,357 |
| 2022 | $4,304 | $565,336 | $127,711 | $437,625 |
| 2021 | $4,221 | $467,214 | $105,545 | $361,669 |
| 2020 | $3,697 | $417,166 | $94,239 | $322,927 |
| 2019 | $3,289 | $382,544 | $86,527 | $296,017 |
| 2018 | $3,607 | $348,923 | $78,823 | $270,100 |
| 2017 | $3,311 | $314,191 | $70,750 | $243,441 |
| 2016 | $3,115 | $306,780 | $66,000 | $240,780 |
| 2015 | $2,761 | $287,085 | $63,480 | $223,605 |
| 2014 | -- | $277,363 | $61,320 | $216,043 |
| 2013 | -- | $276,043 | $60,000 | $216,043 |
Source: Public Records
Map
Nearby Homes
- 8424 Double Ditch Rd
- 902 Captain Bay Ct
- 816 Cedar Dr
- 1656 Liberty St Unit 101
- 805 Cedar Dr
- 735 Ivy St
- 410 10th St
- 108 Fairside Dr Unit 1
- 801 19th St
- 0 Guide Meridian Unit NWM2369980
- 919 Liberty St
- 1884 Front St Unit B
- 1884 Front St
- 1884 Front St Unit A
- 1416 Front St
- 1739 Emerald Way
- 1882 Front St Unit B302
- 208 9th St
- 761 Sunrise Dr
- 1510 E St
- 906 Hemlock Loop
- 917 Barley Ct
- 905 Barley Ct
- 929 Barley Ct
- 901 Hemlock Loop
- 912 Hemlock Loop
- 913 Hemlock Loop
- 941 Barley Ct
- 1744 Pine St
- 875 Abner Ln
- 953 Barley Ct
- 925 Hemlock Loop
- 904 Barley Ct
- 916 Barley Ct
- 0 xxxx Abner Ln
- 918 Hemlock Loop
- 928 Barley Ct
- 924 Hemlock Loop
- 971 Hemlock Loop
- 940 Barley Ct
Your Personal Tour Guide
Ask me questions while you tour the home.