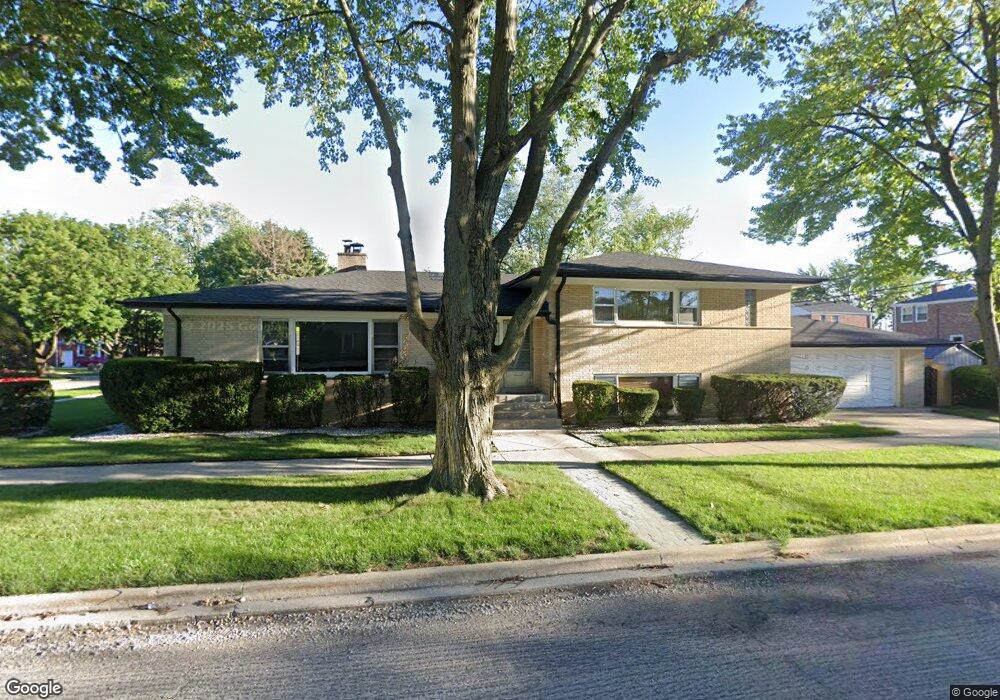
900 Hull Ave Westchester, IL 60154
Estimated Value: $186,000 - $443,000
4
Beds
2
Baths
2,022
Sq Ft
$172/Sq Ft
Est. Value
About This Home
This home is located at 900 Hull Ave, Westchester, IL 60154 and is currently estimated at $347,983, approximately $172 per square foot. 900 Hull Ave is a home located in Cook County with nearby schools including Westchester Primary School, Westchester Intermediate School, and Westchester Middle School.
Ownership History
Date
Name
Owned For
Owner Type
Purchase Details
Closed on
Sep 22, 2025
Sold by
Smith Anthony W
Bought by
Anthony W Smith Trust and Smith
Current Estimated Value
Purchase Details
Closed on
Apr 29, 2025
Sold by
Smith Anthony W and Barnett Angela L
Bought by
Smith Anthony W
Home Financials for this Owner
Home Financials are based on the most recent Mortgage that was taken out on this home.
Original Mortgage
$222,000
Interest Rate
6.75%
Mortgage Type
New Conventional
Purchase Details
Closed on
Jul 22, 2019
Sold by
Smith Anthony W and Smith Angela L
Bought by
Smith Anthony W and Smith Angela L
Purchase Details
Closed on
May 18, 1994
Sold by
State Bank Of Countryside
Bought by
Smith Anthony W and Smith Angela L
Home Financials for this Owner
Home Financials are based on the most recent Mortgage that was taken out on this home.
Original Mortgage
$166,250
Interest Rate
8.34%
Create a Home Valuation Report for This Property
The Home Valuation Report is an in-depth analysis detailing your home's value as well as a comparison with similar homes in the area
Home Values in the Area
Average Home Value in this Area
Purchase History
| Date | Buyer | Sale Price | Title Company |
|---|---|---|---|
| Anthony W Smith Trust | -- | None Listed On Document | |
| Smith Anthony W | $184,000 | Indecomm Global Services | |
| Smith Anthony W | -- | Indecomm Global Services | |
| Smith Anthony W | -- | Attorney | |
| Smith Anthony W | $175,000 | -- |
Source: Public Records
Mortgage History
| Date | Status | Borrower | Loan Amount |
|---|---|---|---|
| Previous Owner | Smith Anthony W | $222,000 | |
| Previous Owner | Smith Anthony W | $166,250 |
Source: Public Records
Tax History Compared to Growth
Tax History
| Year | Tax Paid | Tax Assessment Tax Assessment Total Assessment is a certain percentage of the fair market value that is determined by local assessors to be the total taxable value of land and additions on the property. | Land | Improvement |
|---|---|---|---|---|
| 2024 | $6,307 | $30,000 | $3,832 | $26,168 |
| 2023 | $4,897 | $30,000 | $3,832 | $26,168 |
| 2022 | $4,897 | $22,207 | $3,372 | $18,835 |
| 2021 | $4,788 | $22,207 | $3,372 | $18,835 |
| 2020 | $5,512 | $22,207 | $3,372 | $18,835 |
| 2019 | $5,869 | $24,206 | $3,065 | $21,141 |
| 2018 | $5,791 | $24,206 | $3,065 | $21,141 |
| 2017 | $5,696 | $24,206 | $3,065 | $21,141 |
| 2016 | $5,070 | $19,882 | $2,758 | $17,124 |
| 2015 | $5,300 | $21,032 | $2,758 | $18,274 |
| 2014 | $5,193 | $21,032 | $2,758 | $18,274 |
| 2013 | $5,025 | $22,619 | $2,758 | $19,861 |
Source: Public Records
Map
Nearby Homes
- 723 Balmoral Ave
- 920 Suffolk Ave
- 1119 Newcastle Ave
- 1136 Park Place
- 814 Norfolk Ave
- 805 Norfolk Ave
- 10072 Drury Ln
- 1102 Marshall Ave
- 626 Manchester Ave
- 923 Manchester Ave
- 1035 Bohland Ave
- 750 Bristol Ave
- 1013 Bellwood Ave
- 1023 Rice Ave
- 1022 Eastern Ave
- 1247 S Mannheim Rd Unit 3
- 1108 31st Ave
- 1102 31st Ave
- 942 Bellwood Ave
- 1034 31st Ave
- 906 Hull Ave
- 824 Hull Ave
- 912 Hull Ave
- 901 Westchester Blvd
- 907 Westchester Blvd
- 820 Hull Ave
- 825 Westchester Blvd
- 913 Westchester Blvd
- 918 Hull Ave
- 816 Hull Ave
- 901 Hull Ave
- 927 Westchester Blvd
- 821 Westchester Blvd
- 919 Westchester Blvd
- 913 Hull Ave
- 817 Westchester Blvd
- 924 Hull Ave
- 812 Hull Ave
- 917 Hull Ave
- 921 Westchester Blvd