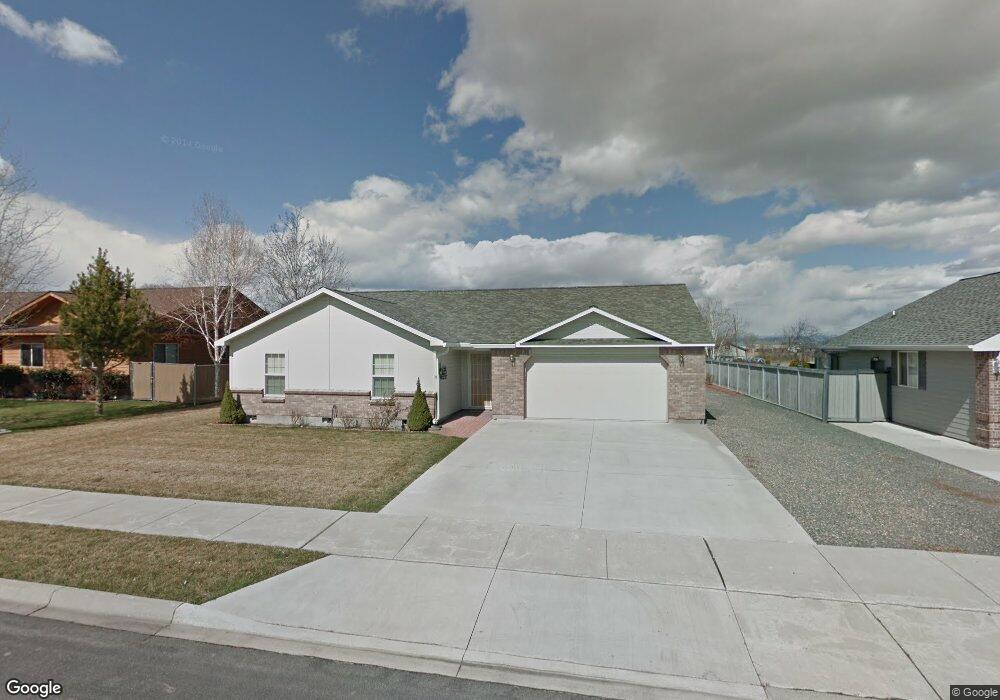
900 Lund Ln Baker City, OR 97814
Estimated Value: $427,685 - $568,000
3
Beds
2
Baths
1,509
Sq Ft
$317/Sq Ft
Est. Value
About This Home
This home is located at 900 Lund Ln, Baker City, OR 97814 and is currently estimated at $477,671, approximately $316 per square foot. 900 Lund Ln is a home located in Baker County with nearby schools including Brooklyn Primary School, Baker Middle School, and Baker High School.
Ownership History
Date
Name
Owned For
Owner Type
Purchase Details
Closed on
Oct 27, 2021
Sold by
Morrissey P & B F Tr
Bought by
Button Linda A and Oconner Samantha E
Current Estimated Value
Home Financials for this Owner
Home Financials are based on the most recent Mortgage that was taken out on this home.
Original Mortgage
$315,000
Outstanding Balance
$287,760
Interest Rate
3.07%
Mortgage Type
Construction
Estimated Equity
$189,911
Purchase Details
Closed on
Dec 29, 2016
Sold by
Scott Rober S and Scott James H
Bought by
Leamaster Joy
Create a Home Valuation Report for This Property
The Home Valuation Report is an in-depth analysis detailing your home's value as well as a comparison with similar homes in the area
Home Values in the Area
Average Home Value in this Area
Purchase History
| Date | Buyer | Sale Price | Title Company |
|---|---|---|---|
| Button Linda A | $395,000 | Amerititle | |
| Leamaster Joy | $200,000 | -- |
Source: Public Records
Mortgage History
| Date | Status | Borrower | Loan Amount |
|---|---|---|---|
| Open | Button Linda A | $315,000 |
Source: Public Records
Tax History Compared to Growth
Tax History
| Year | Tax Paid | Tax Assessment Tax Assessment Total Assessment is a certain percentage of the fair market value that is determined by local assessors to be the total taxable value of land and additions on the property. | Land | Improvement |
|---|---|---|---|---|
| 2025 | $4,744 | $267,420 | $68,533 | $198,887 |
| 2024 | $4,598 | $259,632 | $60,280 | $199,352 |
| 2023 | $4,223 | $235,936 | $42,258 | $193,678 |
| 2022 | $4,106 | $229,065 | $46,413 | $182,652 |
| 2021 | $3,981 | $222,394 | $48,592 | $173,802 |
| 2020 | $3,535 | $215,917 | $49,606 | $166,311 |
| 2019 | $3,338 | $209,629 | $48,464 | $161,165 |
| 2018 | $3,191 | $203,524 | $43,661 | $159,863 |
| 2017 | $3,095 | $197,597 | $30,957 | $166,640 |
| 2016 | $2,848 | $189,870 | $43,910 | $145,960 |
| 2015 | $2,818 | $187,860 | $43,230 | $144,630 |
| 2014 | $2,695 | $179,660 | $42,560 | $137,100 |
| 2013 | -- | $173,540 | $41,270 | $132,270 |
Source: Public Records
Map
Nearby Homes