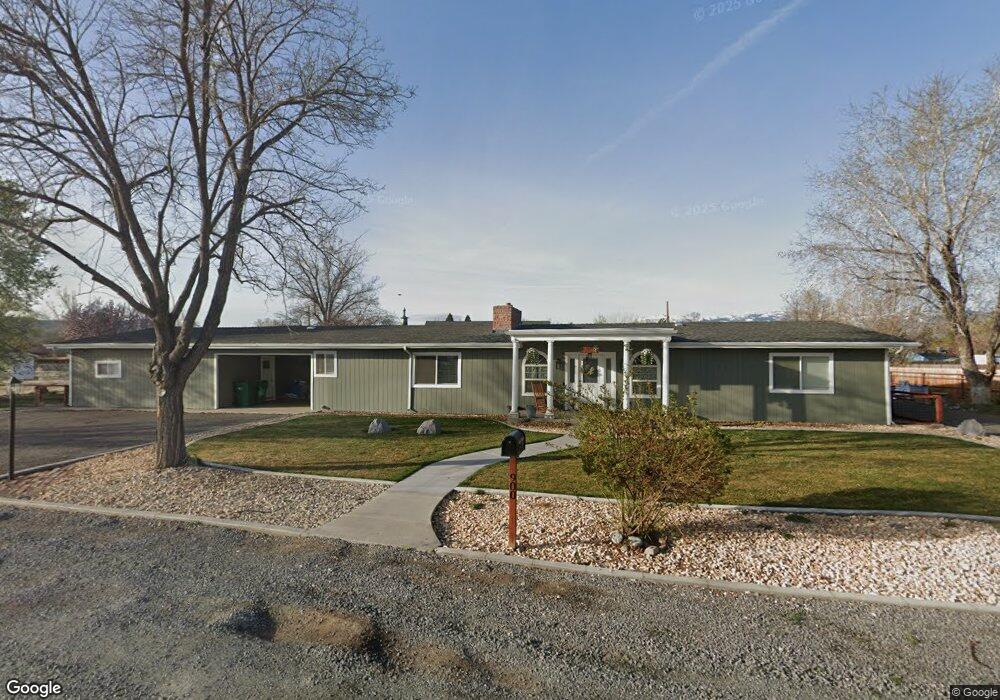
900 Mongolo Dr Sparks, NV 89431
McCarran Boulevard-Probasco NeighborhoodEstimated Value: $517,000 - $704,718
6
Beds
3
Baths
3,334
Sq Ft
$190/Sq Ft
Est. Value
About This Home
This home is located at 900 Mongolo Dr, Sparks, NV 89431 and is currently estimated at $632,680, approximately $189 per square foot. 900 Mongolo Dr is a home located in Washoe County with nearby schools including Florence Drake Elementary School, George L Dilworth Middle School, and Sparks High School.
Ownership History
Date
Name
Owned For
Owner Type
Purchase Details
Closed on
Aug 28, 2015
Sold by
Bowlin Mildred N
Bought by
Ceja Tyler R and Ceja Shelby M
Current Estimated Value
Home Financials for this Owner
Home Financials are based on the most recent Mortgage that was taken out on this home.
Original Mortgage
$212,000
Outstanding Balance
$167,304
Interest Rate
4.05%
Mortgage Type
New Conventional
Estimated Equity
$465,376
Purchase Details
Closed on
Oct 4, 2011
Sold by
Medina Isaac and Medina Ana
Bought by
Bowlin Mildred N
Home Financials for this Owner
Home Financials are based on the most recent Mortgage that was taken out on this home.
Original Mortgage
$145,187
Interest Rate
4.25%
Mortgage Type
FHA
Purchase Details
Closed on
Jul 11, 2005
Sold by
Patton Patton Violet D Violet D
Bought by
Medina Isaac and Medina Ana
Home Financials for this Owner
Home Financials are based on the most recent Mortgage that was taken out on this home.
Original Mortgage
$380,600
Interest Rate
5.55%
Mortgage Type
Fannie Mae Freddie Mac
Create a Home Valuation Report for This Property
The Home Valuation Report is an in-depth analysis detailing your home's value as well as a comparison with similar homes in the area
Home Values in the Area
Average Home Value in this Area
Purchase History
| Date | Buyer | Sale Price | Title Company |
|---|---|---|---|
| Ceja Tyler R | $265,000 | Capital Title Co Of Nevada | |
| Bowlin Mildred N | $149,000 | First American Title Sparks | |
| Medina Isaac | $450,000 | First Centennial Title Co |
Source: Public Records
Mortgage History
| Date | Status | Borrower | Loan Amount |
|---|---|---|---|
| Open | Ceja Tyler R | $212,000 | |
| Previous Owner | Bowlin Mildred N | $145,187 | |
| Previous Owner | Medina Isaac | $380,600 |
Source: Public Records
Tax History Compared to Growth
Tax History
| Year | Tax Paid | Tax Assessment Tax Assessment Total Assessment is a certain percentage of the fair market value that is determined by local assessors to be the total taxable value of land and additions on the property. | Land | Improvement |
|---|---|---|---|---|
| 2025 | $2,363 | $102,940 | $47,250 | $55,690 |
| 2024 | $2,363 | $101,631 | $46,375 | $55,256 |
| 2023 | $2,295 | $93,652 | $42,525 | $51,127 |
| 2022 | $2,228 | $79,590 | $38,500 | $41,090 |
| 2021 | $2,164 | $63,096 | $22,505 | $40,591 |
| 2020 | $2,099 | $62,522 | $22,505 | $40,017 |
| 2019 | $2,039 | $59,444 | $21,035 | $38,409 |
| 2018 | $1,961 | $53,912 | $17,430 | $36,482 |
| 2017 | $1,898 | $51,597 | $15,645 | $35,952 |
| 2016 | $1,895 | $54,009 | $17,500 | $36,509 |
| 2015 | $1,895 | $52,901 | $16,800 | $36,101 |
| 2014 | $1,836 | $51,024 | $16,800 | $34,224 |
| 2013 | -- | $49,026 | $15,750 | $33,276 |
Source: Public Records
Map
Nearby Homes
- 8 E O St
- 370 O'Brien Way
- 10 Sheridan Way
- 1703 1st St
- 745 Glen Vista Dr
- 385 Gleeson Way
- 3071 Meadowlands Dr
- 1973 Rio Tinto Dr
- 120 E Lenwood Dr
- 119 Devere Way
- 3104 Sandy St
- 1940 4th St Unit 20
- 1940 4th St Unit 51
- 913 Glen Molly Dr
- 848 Parkside Dr Unit 1
- 1897 Bonita Vista Dr
- 949 Crestwood Dr Unit 3
- 1945 4th St Unit 32
- 1945 4th St Unit 33
- 3167 Bristle Branch Dr