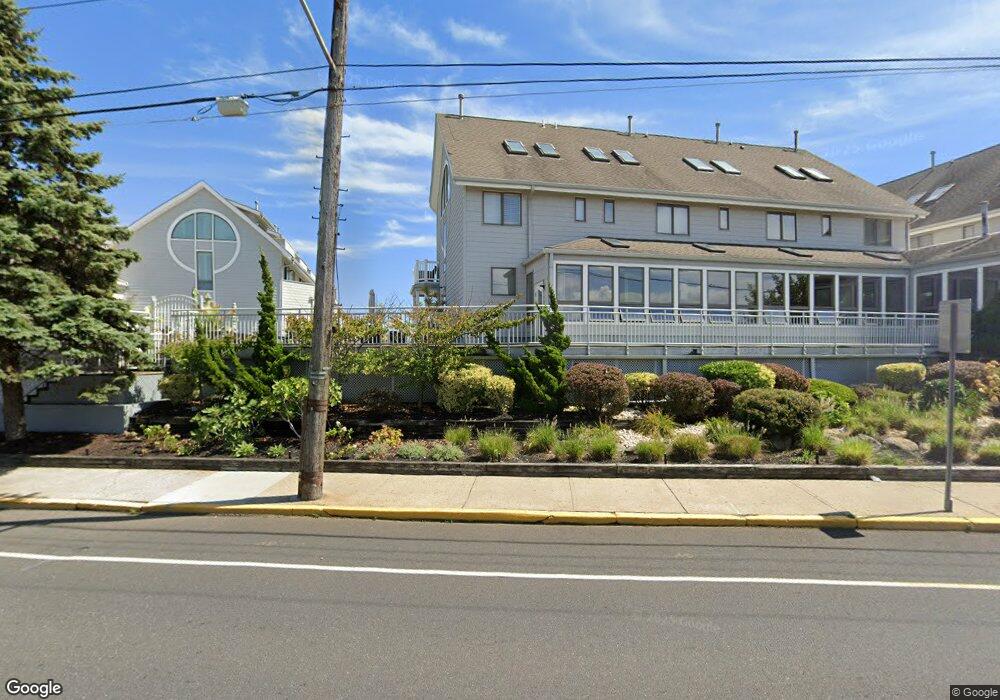
900 Ocean Ave Unit 27 Point Pleasant Beach, NJ 08742
Point Pleasant Beach NeighborhoodEstimated Value: $945,752 - $1,384,000
2
Beds
3
Baths
2,196
Sq Ft
$515/Sq Ft
Est. Value
About This Home
This home is located at 900 Ocean Ave Unit 27, Point Pleasant Beach, NJ 08742 and is currently estimated at $1,131,584, approximately $515 per square foot. 900 Ocean Ave Unit 27 is a home located in Ocean County with nearby schools including G Harold Antrim Elementary School, Point Pleasant Beach High School, and St. Peter School.
Ownership History
Date
Name
Owned For
Owner Type
Purchase Details
Closed on
Feb 9, 2009
Sold by
Johnson Claudia
Bought by
Johnson Jennifer
Current Estimated Value
Home Financials for this Owner
Home Financials are based on the most recent Mortgage that was taken out on this home.
Original Mortgage
$400,000
Outstanding Balance
$253,929
Interest Rate
5.18%
Mortgage Type
Purchase Money Mortgage
Estimated Equity
$877,655
Purchase Details
Closed on
Apr 22, 2002
Sold by
Goldy Shahin
Bought by
Johnson Claudia
Home Financials for this Owner
Home Financials are based on the most recent Mortgage that was taken out on this home.
Original Mortgage
$357,600
Interest Rate
7.18%
Purchase Details
Closed on
Mar 8, 1996
Sold by
Gambino Paul
Bought by
Shahin Naji Abi and Shahin Goldy Abi
Home Financials for this Owner
Home Financials are based on the most recent Mortgage that was taken out on this home.
Original Mortgage
$160,000
Interest Rate
6.97%
Create a Home Valuation Report for This Property
The Home Valuation Report is an in-depth analysis detailing your home's value as well as a comparison with similar homes in the area
Home Values in the Area
Average Home Value in this Area
Purchase History
| Date | Buyer | Sale Price | Title Company |
|---|---|---|---|
| Johnson Jennifer | $500,000 | First American Title Ins Co | |
| Johnson Claudia | $447,000 | -- | |
| Shahin Naji Abi | $240,000 | -- |
Source: Public Records
Mortgage History
| Date | Status | Borrower | Loan Amount |
|---|---|---|---|
| Open | Johnson Jennifer | $400,000 | |
| Closed | Johnson Claudia | $357,600 | |
| Previous Owner | Shahin Naji Abi | $160,000 |
Source: Public Records
Tax History Compared to Growth
Tax History
| Year | Tax Paid | Tax Assessment Tax Assessment Total Assessment is a certain percentage of the fair market value that is determined by local assessors to be the total taxable value of land and additions on the property. | Land | Improvement |
|---|---|---|---|---|
| 2025 | $10,617 | $618,000 | $480,000 | $138,000 |
| 2024 | $10,296 | $618,000 | $480,000 | $138,000 |
| 2023 | $10,005 | $618,000 | $480,000 | $138,000 |
| 2022 | $10,005 | $618,000 | $480,000 | $138,000 |
| 2021 | $9,783 | $618,000 | $480,000 | $138,000 |
| 2020 | $9,771 | $618,000 | $480,000 | $138,000 |
| 2019 | $9,635 | $618,000 | $480,000 | $138,000 |
| 2018 | $9,486 | $618,000 | $480,000 | $138,000 |
| 2017 | $9,338 | $618,000 | $480,000 | $138,000 |
| 2016 | $9,381 | $618,000 | $480,000 | $138,000 |
| 2015 | $9,307 | $618,000 | $480,000 | $138,000 |
| 2014 | $9,264 | $618,000 | $480,000 | $138,000 |
Source: Public Records
Map
Nearby Homes
- 1008 Ocean Ave N
- 118 New York Ave
- 201 Forman Ave
- 1322 Ocean Ave
- 503 Atlantic Ave
- 1604 Lake Ave
- 10 Brunswick Place
- 7 Brunswick Place
- 607 Richmond Ave Unit 4
- 1611 Ocean Ave N
- 1615 Ocean Ave
- 5 Water St
- 143 Boardwalk
- 140 Ocean Ave
- 606 Bay Ave Unit 2
- 606 Bay Ave Unit 3
- 6 Beachcomber Ln Unit 6
- 2 Beachcomber Ln Unit 7-2
- 325 Hawthorne Ave Unit 327
- 202 Yale Ave
- 900 Ocean Ave Unit 29
- 900 Ocean Ave Unit 10
- 900 Ocean Ave Unit 12
- 900 Ocean Ave Unit 1
- 900 Ocean Ave Unit 11
- 900 Ocean Ave Unit 32
- 900 Ocean Ave Unit 15
- 900 Ocean Ave Unit 5
- 900 Ocean Ave Unit 38
- 900 Ocean Ave Unit 28
- 900 Ocean Ave Unit 30
- 900 Ocean Ave Unit 13
- 900 Ocean Ave Unit 31
- 900 Ocean Ave Unit 17
- 900 Ocean Ave Unit 19
- 900 Ocean Ave Unit 9
- 900 Ocean Ave Unit 34
- 900 Ocean Ave Unit 26
- 900 Ocean Ave Unit 21
- 900 Ocean Ave Unit 18