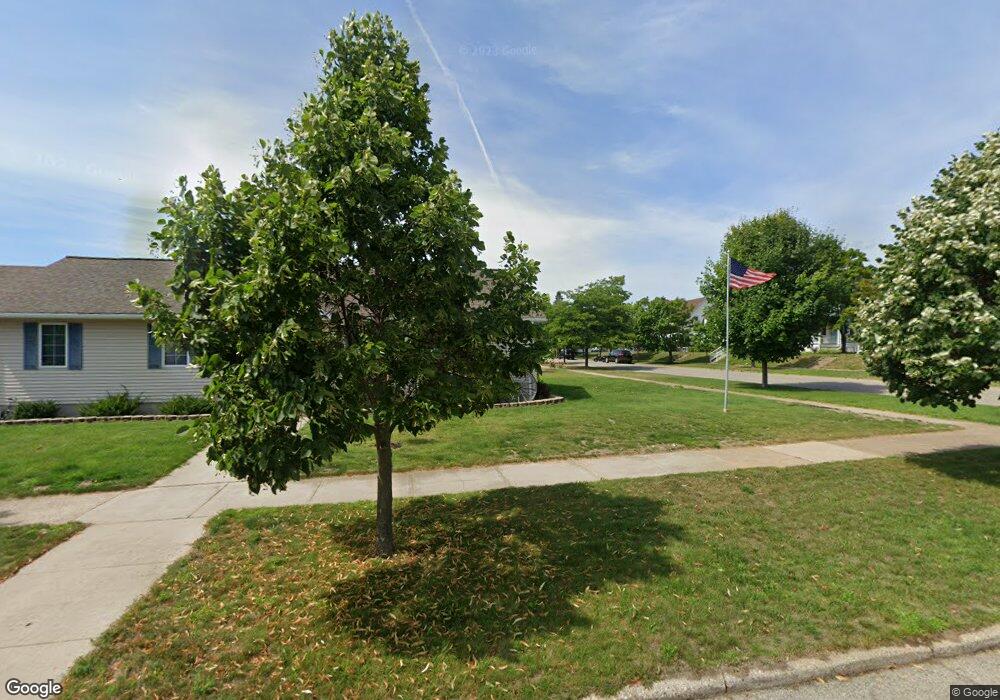
900 S 11th St Escanaba, MI 49829
Estimated Value: $205,000 - $289,882
3
Beds
2
Baths
1,456
Sq Ft
$167/Sq Ft
Est. Value
About This Home
This home is located at 900 S 11th St, Escanaba, MI 49829 and is currently estimated at $242,627, approximately $166 per square foot. 900 S 11th St is a home located in Delta County with nearby schools including Escanaba Jr./Sr. High School, Holy Name Catholic School, and Escanaba Sda School.
Ownership History
Date
Name
Owned For
Owner Type
Purchase Details
Closed on
Mar 25, 2019
Sold by
Johnson Richard B
Bought by
The Salvation Army
Current Estimated Value
Purchase Details
Closed on
Sep 25, 2014
Sold by
Dean F Dean F and Warner Mary L
Bought by
Johnson Richard B and Johnson April L
Home Financials for this Owner
Home Financials are based on the most recent Mortgage that was taken out on this home.
Original Mortgage
$167,000
Interest Rate
4.09%
Mortgage Type
Future Advance Clause Open End Mortgage
Purchase Details
Closed on
May 6, 2002
Bought by
Fisher Anne
Purchase Details
Closed on
Nov 17, 1999
Bought by
City Of Escanaba
Purchase Details
Closed on
Nov 1, 1999
Purchase Details
Closed on
Oct 10, 1982
Bought by
Stenberg Bros Inc
Create a Home Valuation Report for This Property
The Home Valuation Report is an in-depth analysis detailing your home's value as well as a comparison with similar homes in the area
Home Values in the Area
Average Home Value in this Area
Purchase History
| Date | Buyer | Sale Price | Title Company |
|---|---|---|---|
| The Salvation Army | $184,900 | -- | |
| Johnson Richard B | $168,200 | -- | |
| Warner Dean F | -- | -- | |
| Fisher Anne | $18,300 | -- | |
| City Of Escanaba | $187,500 | -- | |
| -- | $187,500 | -- | |
| Stenberg Bros Inc | $9,200 | -- |
Source: Public Records
Mortgage History
| Date | Status | Borrower | Loan Amount |
|---|---|---|---|
| Previous Owner | Warner Dean F | $167,000 |
Source: Public Records
Tax History
| Year | Tax Paid | Tax Assessment Tax Assessment Total Assessment is a certain percentage of the fair market value that is determined by local assessors to be the total taxable value of land and additions on the property. | Land | Improvement |
|---|---|---|---|---|
| 2025 | -- | $0 | $0 | $0 |
| 2024 | -- | $0 | $0 | $0 |
| 2023 | $3,263 | $0 | $0 | $0 |
| 2022 | $3,263 | $0 | $0 | $0 |
| 2020 | $3,263 | $0 | $0 | $0 |
| 2019 | $3,263 | $78,800 | $0 | $0 |
| 2018 | $3,187 | $76,200 | $0 | $0 |
| 2017 | $2,359 | $75,941 | $0 | $0 |
| 2016 | $3,099 | $75,593 | $0 | $0 |
| 2014 | $2,093 | $70,742 | $0 | $0 |
| 2013 | $2,093 | $68,369 | $0 | $0 |
Source: Public Records
Map
Nearby Homes
- 910 13th St S
- 804 S 13th St
- 1524 9th Ave S
- 509 S 10th St
- 517 S 9th St
- 417 S 8th St
- 605 Ogden Ave
- 1020 S 18th St
- 1824 9th Ave S
- 1114 1st Ave S
- 314 S 6th St
- 113 S 10th St
- 1605 17th Ave S
- 1617 17th Ave S
- 1930 S 22nd St
- 200 Ludington Unit 12 St Unit 12
- 200 Ludington Unit 5 St Unit 5
- 200 Ludington Unit 9 St Unit 9
- 200 Ludington Unit 8 St Unit 8
- 200 Ludington Unit 7 St Unit 7
Your Personal Tour Guide
Ask me questions while you tour the home.