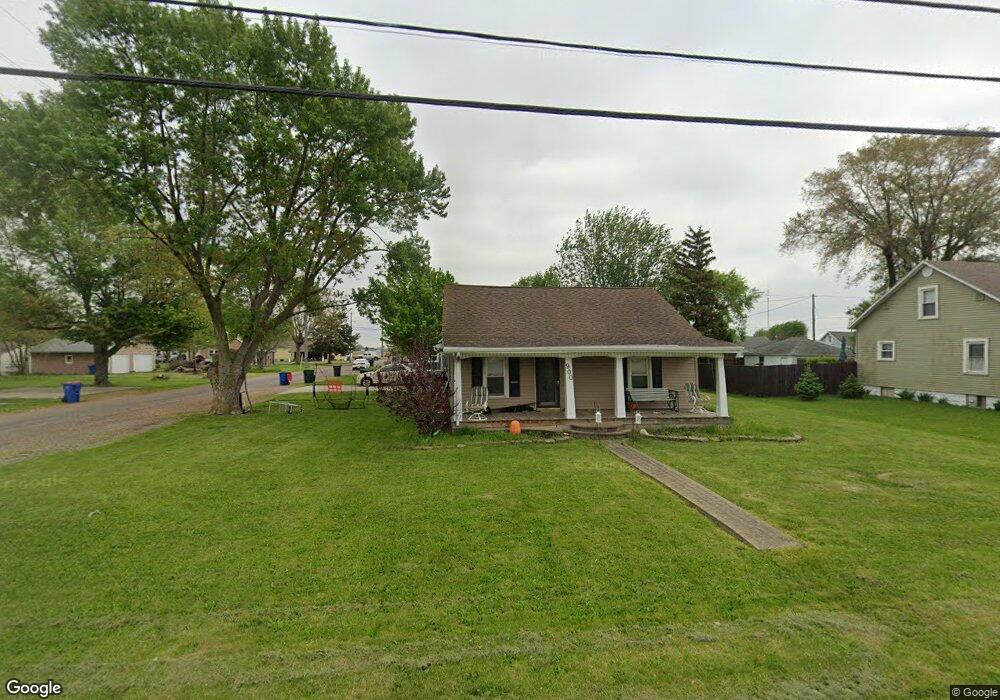
900 Spencerville Rd Delphos, OH 45833
Estimated Value: $132,000 - $162,000
2
Beds
1
Bath
1,128
Sq Ft
$128/Sq Ft
Est. Value
About This Home
This home is located at 900 Spencerville Rd, Delphos, OH 45833 and is currently estimated at $144,226, approximately $127 per square foot. 900 Spencerville Rd is a home located in Allen County with nearby schools including Delphos St. John's High School and Delphos St. John's Elementary School.
Ownership History
Date
Name
Owned For
Owner Type
Purchase Details
Closed on
Jun 19, 2007
Sold by
Dancer Shawn M
Bought by
Kriegel Ryan M
Current Estimated Value
Home Financials for this Owner
Home Financials are based on the most recent Mortgage that was taken out on this home.
Original Mortgage
$75,000
Outstanding Balance
$44,153
Interest Rate
5.5%
Mortgage Type
Assumption
Estimated Equity
$100,073
Purchase Details
Closed on
Aug 8, 2000
Sold by
Dancer Sue
Bought by
Dancer Shawn M
Home Financials for this Owner
Home Financials are based on the most recent Mortgage that was taken out on this home.
Original Mortgage
$47,500
Interest Rate
8.19%
Mortgage Type
New Conventional
Purchase Details
Closed on
Mar 24, 1998
Sold by
Diltz Hazel
Bought by
Dancer Sue
Home Financials for this Owner
Home Financials are based on the most recent Mortgage that was taken out on this home.
Original Mortgage
$31,955
Interest Rate
7.14%
Mortgage Type
New Conventional
Purchase Details
Closed on
May 1, 1982
Bought by
Diltz Hazel M
Create a Home Valuation Report for This Property
The Home Valuation Report is an in-depth analysis detailing your home's value as well as a comparison with similar homes in the area
Home Values in the Area
Average Home Value in this Area
Purchase History
| Date | Buyer | Sale Price | Title Company |
|---|---|---|---|
| Kriegel Ryan M | $75,000 | None Available | |
| Dancer Shawn M | $55,000 | -- | |
| Dancer Sue | $22,000 | -- | |
| Diltz Hazel M | -- | -- |
Source: Public Records
Mortgage History
| Date | Status | Borrower | Loan Amount |
|---|---|---|---|
| Open | Kriegel Ryan M | $75,000 | |
| Previous Owner | Dancer Shawn M | $47,500 | |
| Previous Owner | Dancer Sue | $31,955 |
Source: Public Records
Tax History Compared to Growth
Tax History
| Year | Tax Paid | Tax Assessment Tax Assessment Total Assessment is a certain percentage of the fair market value that is determined by local assessors to be the total taxable value of land and additions on the property. | Land | Improvement |
|---|---|---|---|---|
| 2024 | $1,041 | $33,500 | $7,180 | $26,320 |
| 2023 | $823 | $25,000 | $5,360 | $19,640 |
| 2022 | $843 | $25,000 | $5,360 | $19,640 |
| 2021 | $850 | $25,000 | $5,360 | $19,640 |
| 2020 | $742 | $23,070 | $5,110 | $17,960 |
| 2019 | $742 | $23,070 | $5,110 | $17,960 |
| 2018 | $736 | $23,070 | $5,110 | $17,960 |
| 2017 | $701 | $21,420 | $5,110 | $16,310 |
| 2016 | $715 | $21,420 | $5,110 | $16,310 |
| 2015 | $728 | $21,420 | $5,110 | $16,310 |
| 2014 | $728 | $22,020 | $4,900 | $17,120 |
| 2013 | $733 | $22,020 | $4,900 | $17,120 |
Source: Public Records
Map
Nearby Homes
- 827 S Washington St
- 483 S Franklin St
- 516 S Main St
- 1400 S Clay St Unit 17
- 634 S Clay St
- 424 S Canal St
- 221 S Main St
- 633 E 2nd St
- 210 E 3rd St
- 405 N Franklin St
- 7110 Elida Rd
- 521 Carolyn Dr
- 610 N Washington St
- 409 N Bredeick St
- 704 N Franklin St
- 810 N Franklin St
- 604 W 6th St
- 1303 Carolyn Dr
- 1220 Rose Anna Dr
- 11630 Clearview Dr