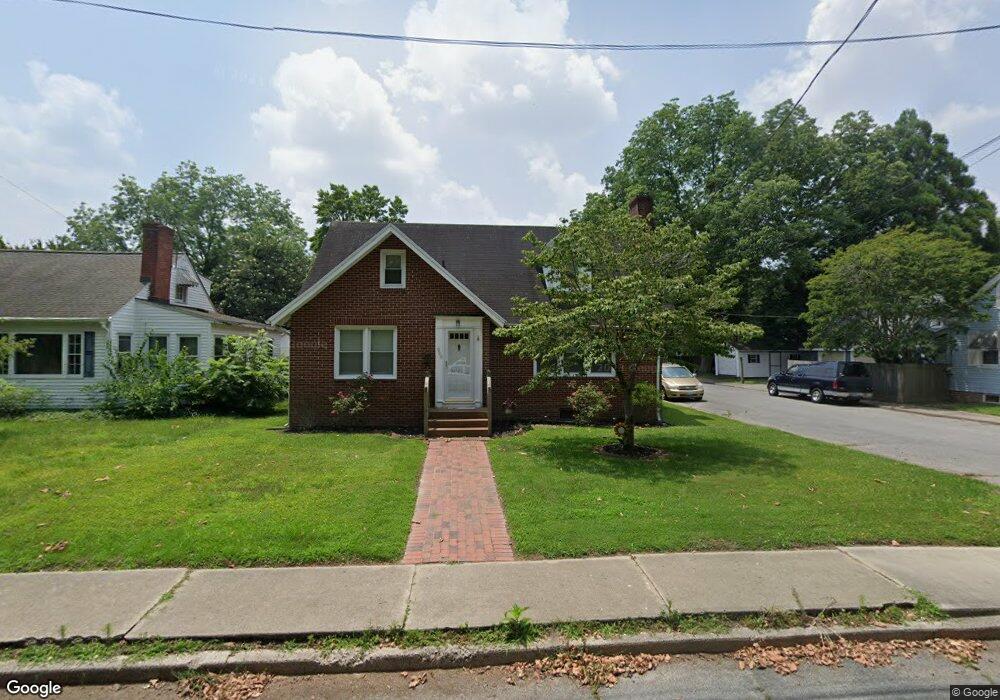
900 Walnut St Pocomoke City, MD 21851
Estimated Value: $250,462 - $264,000
4
Beds
2
Baths
1,692
Sq Ft
$152/Sq Ft
Est. Value
About This Home
This home is located at 900 Walnut St, Pocomoke City, MD 21851 and is currently estimated at $256,366, approximately $151 per square foot. 900 Walnut St is a home located in Worcester County with nearby schools including Pocomoke Elementary School, Pocomoke Middle School, and Pocomoke High School.
Ownership History
Date
Name
Owned For
Owner Type
Purchase Details
Closed on
Jul 11, 2014
Sold by
Caln Jeffrey L and Cain Kathleen M
Bought by
Johnson Corry T and Johnson Constance L
Current Estimated Value
Home Financials for this Owner
Home Financials are based on the most recent Mortgage that was taken out on this home.
Original Mortgage
$132,456
Outstanding Balance
$100,968
Interest Rate
4.18%
Mortgage Type
FHA
Estimated Equity
$155,398
Purchase Details
Closed on
May 29, 1998
Sold by
Jones Mary R
Bought by
Cain Jeffrey L and Cain Kathleen M
Purchase Details
Closed on
Apr 15, 1997
Sold by
Jones Otho J
Bought by
Jones Mary R
Create a Home Valuation Report for This Property
The Home Valuation Report is an in-depth analysis detailing your home's value as well as a comparison with similar homes in the area
Home Values in the Area
Average Home Value in this Area
Purchase History
| Date | Buyer | Sale Price | Title Company |
|---|---|---|---|
| Johnson Corry T | $134,900 | None Available | |
| Cain Jeffrey L | $79,900 | -- | |
| Jones Mary R | -- | -- |
Source: Public Records
Mortgage History
| Date | Status | Borrower | Loan Amount |
|---|---|---|---|
| Open | Johnson Corry T | $132,456 | |
| Closed | Cain Jeffrey L | -- |
Source: Public Records
Tax History Compared to Growth
Tax History
| Year | Tax Paid | Tax Assessment Tax Assessment Total Assessment is a certain percentage of the fair market value that is determined by local assessors to be the total taxable value of land and additions on the property. | Land | Improvement |
|---|---|---|---|---|
| 2025 | $3,344 | $180,200 | $24,200 | $156,000 |
| 2024 | $3,008 | $159,533 | $0 | $0 |
| 2023 | $2,618 | $138,867 | $0 | $0 |
| 2022 | $2,229 | $118,200 | $24,200 | $94,000 |
| 2021 | $2,231 | $117,767 | $0 | $0 |
| 2020 | $2,223 | $117,333 | $0 | $0 |
| 2019 | $2,215 | $116,900 | $24,200 | $92,700 |
| 2018 | $1,906 | $106,567 | $0 | $0 |
| 2017 | $1,814 | $96,233 | $0 | $0 |
| 2016 | $1,619 | $85,900 | $0 | $0 |
| 2015 | $1,717 | $85,900 | $0 | $0 |
| 2014 | $1,717 | $85,900 | $0 | $0 |
Source: Public Records
Map
Nearby Homes