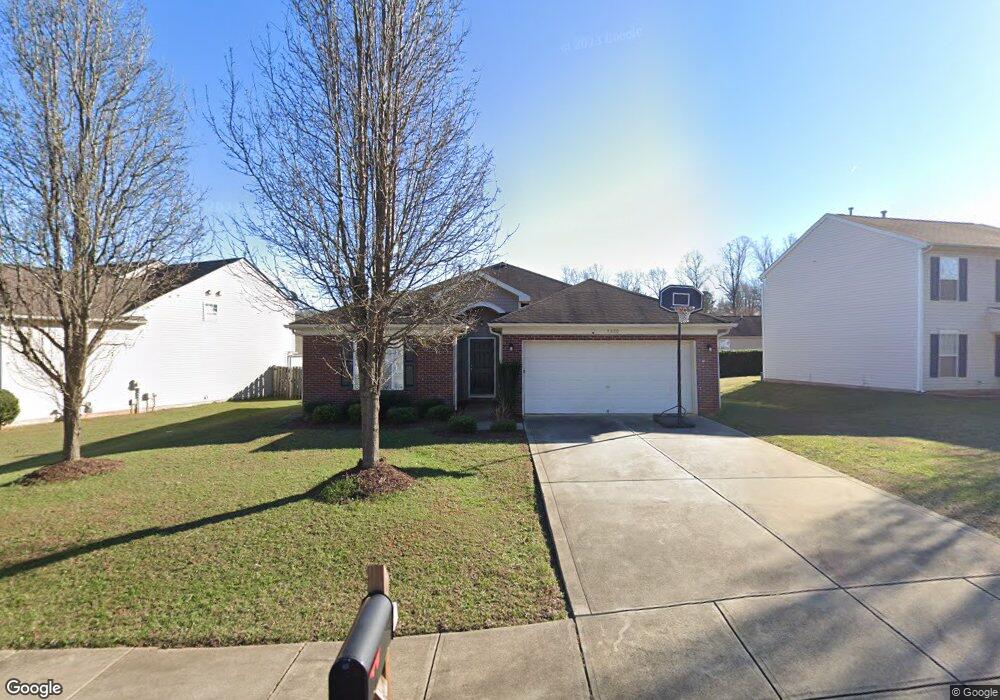
9000 Mcadam Way Charlotte, NC 28269
West Sugar Creek NeighborhoodEstimated Value: $288,000 - $317,040
3
Beds
3
Baths
1,470
Sq Ft
$206/Sq Ft
Est. Value
About This Home
This home is located at 9000 Mcadam Way, Charlotte, NC 28269 and is currently estimated at $303,510, approximately $206 per square foot. 9000 Mcadam Way is a home located in Mecklenburg County with nearby schools including David Cox Road Elementary, Ridge Road Middle School, and Mallard Creek High School.
Ownership History
Date
Name
Owned For
Owner Type
Purchase Details
Closed on
Nov 1, 2018
Sold by
Opendoor Properties C Llc
Bought by
Sfr Jv 1 Proeprty Llc
Current Estimated Value
Purchase Details
Closed on
Oct 11, 2018
Sold by
Carstarphen Byron and Carstarphen Michelle
Bought by
Opendoor Property C Llc
Purchase Details
Closed on
Aug 22, 2003
Sold by
The Ryland Group Inc
Bought by
Carstarphen Byron
Home Financials for this Owner
Home Financials are based on the most recent Mortgage that was taken out on this home.
Original Mortgage
$129,514
Interest Rate
5.52%
Mortgage Type
FHA
Purchase Details
Closed on
Jun 24, 2003
Sold by
Edgefield Subdivision Llc
Bought by
The Ryland Group Inc
Home Financials for this Owner
Home Financials are based on the most recent Mortgage that was taken out on this home.
Original Mortgage
$129,514
Interest Rate
5.52%
Mortgage Type
FHA
Create a Home Valuation Report for This Property
The Home Valuation Report is an in-depth analysis detailing your home's value as well as a comparison with similar homes in the area
Home Values in the Area
Average Home Value in this Area
Purchase History
| Date | Buyer | Sale Price | Title Company |
|---|---|---|---|
| Sfr Jv 1 Proeprty Llc | $162,000 | None Available | |
| Opendoor Property C Llc | $169,000 | None Available | |
| Carstarphen Byron | $131,000 | -- | |
| The Ryland Group Inc | $119,500 | -- |
Source: Public Records
Mortgage History
| Date | Status | Borrower | Loan Amount |
|---|---|---|---|
| Previous Owner | Carstarphen Byron | $129,514 |
Source: Public Records
Tax History Compared to Growth
Tax History
| Year | Tax Paid | Tax Assessment Tax Assessment Total Assessment is a certain percentage of the fair market value that is determined by local assessors to be the total taxable value of land and additions on the property. | Land | Improvement |
|---|---|---|---|---|
| 2025 | $2,365 | $292,100 | $70,000 | $222,100 |
| 2024 | $2,365 | $292,100 | $70,000 | $222,100 |
| 2023 | $2,282 | $292,100 | $70,000 | $222,100 |
| 2022 | $1,705 | $163,700 | $30,000 | $133,700 |
| 2021 | $1,694 | $163,700 | $30,000 | $133,700 |
| 2020 | $1,687 | $163,700 | $30,000 | $133,700 |
| 2019 | $1,752 | $172,100 | $30,000 | $142,100 |
| 2018 | $1,245 | $89,300 | $17,500 | $71,800 |
| 2017 | $1,219 | $89,300 | $17,500 | $71,800 |
| 2016 | $1,209 | $89,300 | $17,500 | $71,800 |
| 2015 | $1,198 | $89,300 | $17,500 | $71,800 |
| 2014 | $1,209 | $89,300 | $17,500 | $71,800 |
Source: Public Records
Map
Nearby Homes
- 9413 Munsing Dr
- 9400 Munsing Dr Unit 147
- 9404 Munsing Dr
- 9404 Munsing Dr Unit 148
- 9412 Munsing Dr Unit 150
- 9416 Munsing Dr Unit 151
- 9420 Munsing Dr
- 5034 Glenwalk Dr Unit 22
- Wynn Plan at Griffith Lakes - Waterstone Collection
- Ronelle Plan at Griffith Lakes - Waterstone Collection
- Nora Plan at Griffith Lakes - Waterstone Collection
- Dilworth Plan at Griffith Lakes - Cottage Collection
- Westview Plan at Griffith Lakes - Cottage Collection
- Dean Plan at Griffith Lakes - Cottage Collection
- Woodrow Plan at Griffith Lakes - Cottage Collection
- Badin Plan at Griffith Lakes - Preserve Collection
- William Plan at Griffith Lakes - Preserve Collection
- Trawick Plan at Griffith Lakes - Cottage Collection
- Devin Plan at Griffith Lakes - Preserve Collection
- Tahoma Plan at Griffith Lakes - Preserve Collection
- 9008 Mcadam Way
- 8940 Mcadam Way
- 9012 Mcadam Way
- 5109 Burnaby Ct
- 5113 Burnaby Ct
- 5105 Burnaby Ct
- 5105 Burnaby Ct Unit 47
- 7507 Melstrand Way
- 7504 Melstrand Way
- 5117 Burnaby Ct
- 9016 Mcadam Way
- 5101 Burnaby Ct
- 5121 Burnaby Ct
- 7508 Melstrand Way
- 8943 Mcadam Way
- 9020 Mcadam Way
- 5024 Deerton Rd
- 5024 Deerton Rd
- 5024 Deerton Rd Unit 16
- 5125 Burnaby Ct