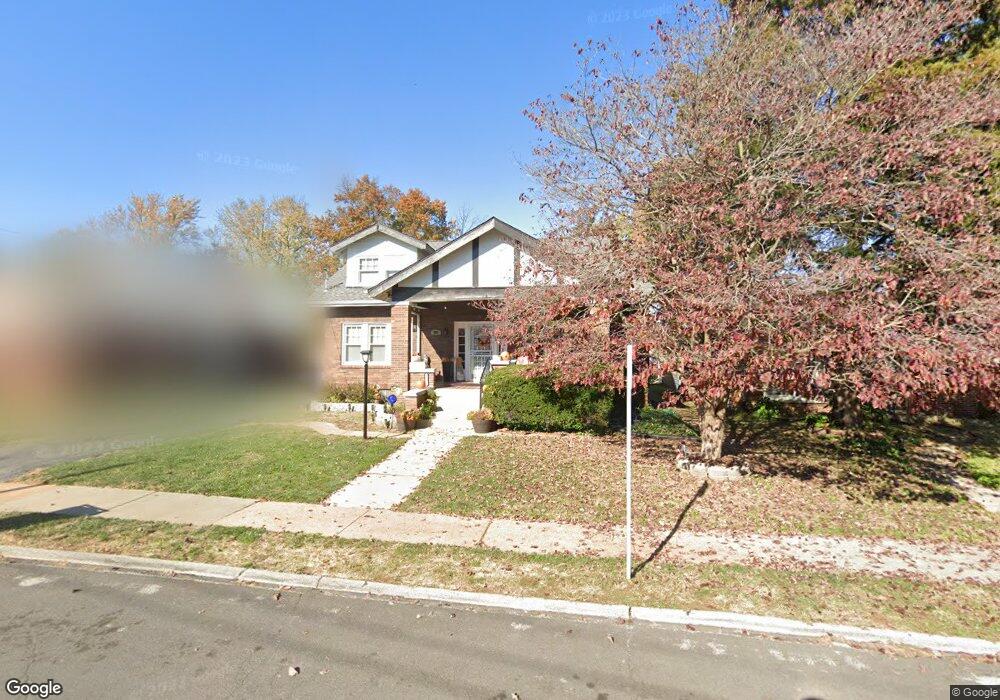
9003 Windom Ave Saint Louis, MO 63114
Estimated Value: $190,890 - $268,000
4
Beds
2
Baths
2,191
Sq Ft
$102/Sq Ft
Est. Value
About This Home
This home is located at 9003 Windom Ave, Saint Louis, MO 63114 and is currently estimated at $223,223, approximately $101 per square foot. 9003 Windom Ave is a home located in St. Louis County with nearby schools including Wyland Elementary School, Ritenour Middle School, and Ritenour Senior High School.
Ownership History
Date
Name
Owned For
Owner Type
Purchase Details
Closed on
Sep 28, 2022
Sold by
Ray Johnson Lonnie and Ray Karen L
Bought by
Lonnie R Johnson And Karen L Johnson Revocabl
Current Estimated Value
Purchase Details
Closed on
Dec 26, 2018
Sold by
Johnson Lonnie Ray and Johnson Lonnie Ray
Bought by
Johnson Lonnie Ray and Johnson Karen L
Home Financials for this Owner
Home Financials are based on the most recent Mortgage that was taken out on this home.
Original Mortgage
$90,000
Interest Rate
4.8%
Mortgage Type
New Conventional
Purchase Details
Closed on
Aug 15, 2012
Sold by
The Thelma I Goergens Irrevocable Reside
Bought by
Hollis Johnson Michele and Johnson Lonnie Ray
Home Financials for this Owner
Home Financials are based on the most recent Mortgage that was taken out on this home.
Original Mortgage
$90,695
Interest Rate
3.57%
Mortgage Type
New Conventional
Create a Home Valuation Report for This Property
The Home Valuation Report is an in-depth analysis detailing your home's value as well as a comparison with similar homes in the area
Home Values in the Area
Average Home Value in this Area
Purchase History
| Date | Buyer | Sale Price | Title Company |
|---|---|---|---|
| Lonnie R Johnson And Karen L Johnson Revocabl | -- | -- | |
| Johnson Lonnie Ray | -- | Stewart Title Guaranty | |
| Hollis Johnson Michele | $93,500 | Title Partners Agency Llc |
Source: Public Records
Mortgage History
| Date | Status | Borrower | Loan Amount |
|---|---|---|---|
| Previous Owner | Johnson Lonnie Ray | $90,000 | |
| Previous Owner | Hollis Johnson Michele | $90,695 |
Source: Public Records
Tax History
| Year | Tax Paid | Tax Assessment Tax Assessment Total Assessment is a certain percentage of the fair market value that is determined by local assessors to be the total taxable value of land and additions on the property. | Land | Improvement |
|---|---|---|---|---|
| 2025 | $2,511 | $33,630 | $7,200 | $26,430 |
| 2024 | $2,511 | $29,360 | $3,290 | $26,070 |
| 2023 | $2,456 | $29,360 | $3,290 | $26,070 |
| 2022 | $2,385 | $25,010 | $2,890 | $22,120 |
| 2021 | $2,384 | $25,010 | $2,890 | $22,120 |
| 2020 | $2,593 | $25,120 | $4,600 | $20,520 |
| 2019 | $2,565 | $25,120 | $4,600 | $20,520 |
| 2018 | $2,370 | $20,880 | $2,130 | $18,750 |
| 2017 | $2,260 | $20,880 | $2,130 | $18,750 |
| 2016 | $1,927 | $18,110 | $2,890 | $15,220 |
Source: Public Records
Map
Nearby Homes
- 9038 Tudor Ave
- 9017 Tudor Ave
- 9034 Argyle Ave
- 3311 Eminence Blvd
- 3315 Eminence Blvd
- 3237 Marshall Ave
- 8766 Burton Ave
- 3304 S Gordon Ct
- 2408 Charlack Ave
- 2448 Gothland Ave
- 9432 Tudor Ave
- 2424 Gothland Ave
- 8710 Ezra Dr
- 3108 Quiet Ln
- 25 Jonell Ct
- 9310 Shirley Gardens Dr
- 9527 W Milton Ave
- 3219 Coles Ave
- 3630 Brown Rd
- 9060 Patrick Dr
- 9001 Windom Ave
- 3006 Charlack Ave
- 9007 Windom Ave
- 8965 Windom Ave
- 9011 Windom Ave
- 9002 Tudor Ave
- 9004 Tudor Ave
- 8968 Tudor Ave
- 8953 Windom Ave
- 9015 Windom Ave
- 9004 Windom Ave
- 9008 Windom Ave
- 9014 Tudor Ave
- 8958 Windom Ave
- 8951 Windom Ave
- 8960 Tudor Ave
- 9019 Windom Ave
- 8956 Windom Ave
- 9018 Tudor Ave
- 9020 Windom Ave
Your Personal Tour Guide
Ask me questions while you tour the home.