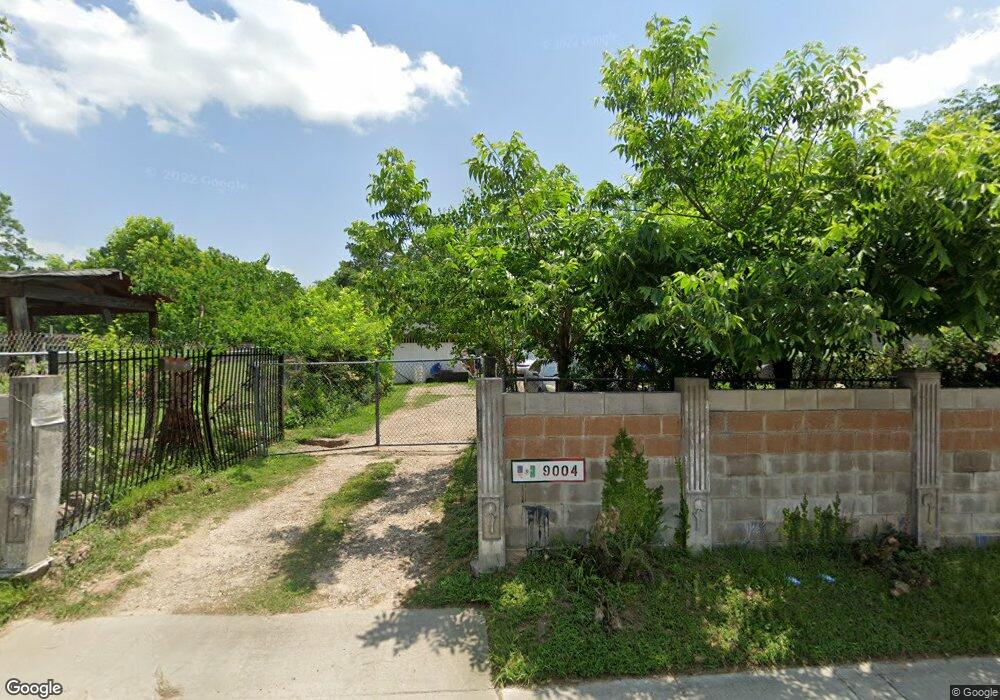
9004 Lockwood Dr Houston, TX 77016
Trinity-Houston Gardens NeighborhoodEstimated Value: $154,000 - $194,000
3
Beds
1
Bath
880
Sq Ft
$196/Sq Ft
Est. Value
About This Home
This home is located at 9004 Lockwood Dr, Houston, TX 77016 and is currently estimated at $172,621, approximately $196 per square foot. 9004 Lockwood Dr is a home located in Harris County with nearby schools including Felix Cook Jr. Elementary School, Key Middle, and Kashmere High School.
Ownership History
Date
Name
Owned For
Owner Type
Purchase Details
Closed on
Oct 27, 2018
Sold by
Fuente Oralia De La and Sanchez Nestor Charles
Bought by
Barrera Hernandez Jose Arturo and Hernandez Perez Leonila
Current Estimated Value
Home Financials for this Owner
Home Financials are based on the most recent Mortgage that was taken out on this home.
Original Mortgage
$42,500
Interest Rate
4.4%
Mortgage Type
Land Contract Argmt. Of Sale
Purchase Details
Closed on
Sep 26, 2016
Sold by
Torres Alpidio and De La Fuente Maria Oralia
Bought by
Delafuente Oralia and Delafuente Charles Pena
Purchase Details
Closed on
Nov 11, 2006
Sold by
Windham Harvey Baker
Bought by
Torres Alpidio and Dela Fuente Maria Oralia
Purchase Details
Closed on
Aug 5, 2003
Sold by
Hagan Robert
Bought by
Windham Harvey Baker
Create a Home Valuation Report for This Property
The Home Valuation Report is an in-depth analysis detailing your home's value as well as a comparison with similar homes in the area
Home Values in the Area
Average Home Value in this Area
Purchase History
| Date | Buyer | Sale Price | Title Company |
|---|---|---|---|
| Barrera Hernandez Jose Arturo | $42,500 | None Available | |
| Delafuente Oralia | -- | None Available | |
| Torres Alpidio | $15,000 | None Available | |
| Windham Harvey Baker | $4,900 | -- |
Source: Public Records
Mortgage History
| Date | Status | Borrower | Loan Amount |
|---|---|---|---|
| Previous Owner | Barrera Hernandez Jose Arturo | $42,500 |
Source: Public Records
Tax History Compared to Growth
Tax History
| Year | Tax Paid | Tax Assessment Tax Assessment Total Assessment is a certain percentage of the fair market value that is determined by local assessors to be the total taxable value of land and additions on the property. | Land | Improvement |
|---|---|---|---|---|
| 2025 | $3,322 | $158,773 | $66,600 | $92,173 |
| 2024 | $3,322 | $158,773 | $66,600 | $92,173 |
| 2023 | $2,906 | $144,208 | $66,600 | $77,608 |
| 2022 | $2,468 | $112,094 | $44,400 | $67,694 |
| 2021 | $2,047 | $87,842 | $28,860 | $58,982 |
| 2020 | $1,725 | $71,218 | $19,980 | $51,238 |
| 2019 | $1,560 | $61,657 | $14,208 | $47,449 |
| 2018 | $1,349 | $53,294 | $14,208 | $39,086 |
| 2017 | $1,348 | $53,294 | $14,208 | $39,086 |
| 2016 | $1,272 | $50,313 | $11,100 | $39,213 |
| 2015 | $972 | $48,661 | $8,880 | $39,781 |
| 2014 | $972 | $37,810 | $8,880 | $28,930 |
Source: Public Records
Map
Nearby Homes
- 5017 Boicewood St
- 5105 Earline St
- 4915 Fitch St
- 5109 Earline St
- 4814 Firnat St
- 5022 Laura Koppe Rd
- 4619 Laura Koppe Rd
- 10413 Peachtree St
- 4609 Laura Koppe Rd
- 6316 Laura Koppe Rd
- 4924 Tronewood St
- 8717 Peachtree St
- 4917 Tronewood St
- 4625 Laura Koppe Rd
- 4622 Firnat St
- 7212 Lockwood Dr
- 8617 Clarington St
- 9118 Sandra St Unit A and B
- 7310 Lockwood Dr
- 4506 Boicewood St
- 4911 Boicewood St
- 5001 Boicewood St
- 4910 Fitch St
- 5009 Boicewood St
- 9012 Lockwood Dr
- 5010 Fitch St
- 5000 Boicewood St
- 4914 Boicewood St
- 8918 Lockwood Dr
- 5013 Boicewood St
- 5002 Boicewood St
- 8914 Lockwood Dr
- 5017 Boicewood St
- 5017 Boicewood St Unit 2
- 5017 Boicewood St Unit 1
- 9102 Lockwood Dr
- 9007 Lockwood Dr
- 5014 Boicewood St
- 8910 Lockwood Dr
- 9009 Lockwood Dr