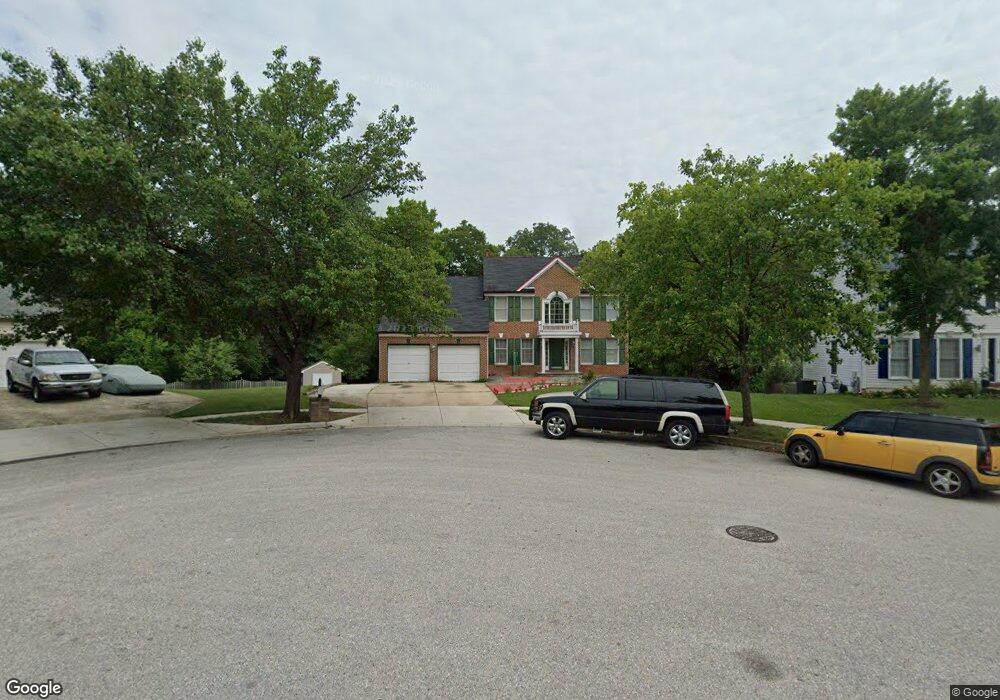
9005 Harness Way Bowie, MD 20715
Jericho Park NeighborhoodEstimated Value: $704,000 - $746,000
5
Beds
4
Baths
2,592
Sq Ft
$278/Sq Ft
Est. Value
About This Home
This home is located at 9005 Harness Way, Bowie, MD 20715 and is currently estimated at $721,097, approximately $278 per square foot. 9005 Harness Way is a home located in Prince George's County with nearby schools including Yorktown Elementary School, Samuel Ogle Middle School, and Bowie High School.
Ownership History
Date
Name
Owned For
Owner Type
Purchase Details
Closed on
Jun 21, 2006
Sold by
Linn Kathryn
Bought by
Zelaya Melsin A
Current Estimated Value
Home Financials for this Owner
Home Financials are based on the most recent Mortgage that was taken out on this home.
Original Mortgage
$120,000
Interest Rate
6.42%
Mortgage Type
Stand Alone Second
Purchase Details
Closed on
May 2, 2006
Sold by
Linn Kathryn
Bought by
Zelaya Melsin A
Home Financials for this Owner
Home Financials are based on the most recent Mortgage that was taken out on this home.
Original Mortgage
$120,000
Interest Rate
6.42%
Mortgage Type
Stand Alone Second
Purchase Details
Closed on
Apr 3, 2002
Sold by
Byers Scott A
Bought by
Linn Kathryn and Linn Eric H
Purchase Details
Closed on
Jun 2, 1993
Sold by
Oakmont Homes Inc
Bought by
Byers Scott A and Byers June A
Create a Home Valuation Report for This Property
The Home Valuation Report is an in-depth analysis detailing your home's value as well as a comparison with similar homes in the area
Home Values in the Area
Average Home Value in this Area
Purchase History
| Date | Buyer | Sale Price | Title Company |
|---|---|---|---|
| Zelaya Melsin A | $600,000 | -- | |
| Zelaya Melsin A | $600,000 | -- | |
| Linn Kathryn | $310,000 | -- | |
| Byers Scott A | $260,500 | -- |
Source: Public Records
Mortgage History
| Date | Status | Borrower | Loan Amount |
|---|---|---|---|
| Closed | Zelaya Melsin A | $120,000 | |
| Open | Zelaya Melsin A | $480,000 | |
| Previous Owner | Zelaya Melsin A | $480,000 |
Source: Public Records
Tax History Compared to Growth
Tax History
| Year | Tax Paid | Tax Assessment Tax Assessment Total Assessment is a certain percentage of the fair market value that is determined by local assessors to be the total taxable value of land and additions on the property. | Land | Improvement |
|---|---|---|---|---|
| 2025 | $8,418 | $584,700 | $129,800 | $454,900 |
| 2024 | $8,418 | $539,667 | $0 | $0 |
| 2023 | $7,748 | $494,633 | $0 | $0 |
| 2022 | $7,079 | $449,600 | $104,800 | $344,800 |
| 2021 | $6,900 | $437,567 | $0 | $0 |
| 2020 | $6,721 | $425,533 | $0 | $0 |
| 2019 | $6,542 | $413,500 | $102,400 | $311,100 |
| 2018 | $6,404 | $404,167 | $0 | $0 |
| 2017 | $6,265 | $394,833 | $0 | $0 |
| 2016 | -- | $385,500 | $0 | $0 |
| 2015 | $6,112 | $374,433 | $0 | $0 |
| 2014 | $6,112 | $363,367 | $0 | $0 |
Source: Public Records
Map
Nearby Homes
- 8917 Race Track Rd
- 9012 Race Track Rd
- 15005 Running Park Ct
- 12506 Rockledge Dr
- 13803 Old Jericho Park Rd
- 13928 Pecan Ridge Way
- 13926 Pecan Ridge Way
- 13924 Pecan Ridge Way
- Annapolis - Craftsman Plan at Pecan Ridge
- Monterey II - Craftsman Plan at Pecan Ridge
- Emory II - Craftsman Plan at Pecan Ridge
- Deerfield Plan at Pecan Ridge
- Colorado Plan at Pecan Ridge
- 7905 Oxfarm Ct
- 12400 Rambling Ln
- 13814 Pecan Ridge Way
- 13812 Pecan Ridge Way
- 13314 10th St
- 2739 Sand Lens Dr
- 4520 Oaklyn Ln
- 9003 Harness Way
- 9001 Harness Way
- 5009 Patuxent Riding Ln
- 5007 Patuxent Riding Ln
- 9004 Harness Way
- 5011 Patuxent Riding Ln
- 9006 Harness Way
- 9002 Harness Way
- 14704 Winners Ct
- 8915 Harness Way
- 5005 Patuxent Riding Ln
- 5013 Patuxent Riding Ln
- 14702 Winners Ct
- 8913 Harness Way
- 5003 Patuxent Riding Ln
- 5015 Patuxent Riding Ln
- 5008 Patuxent Riding Ln
- 14703 Winners Ct
- 8821 Race Track Rd
- 5004 Patuxent Riding Ln