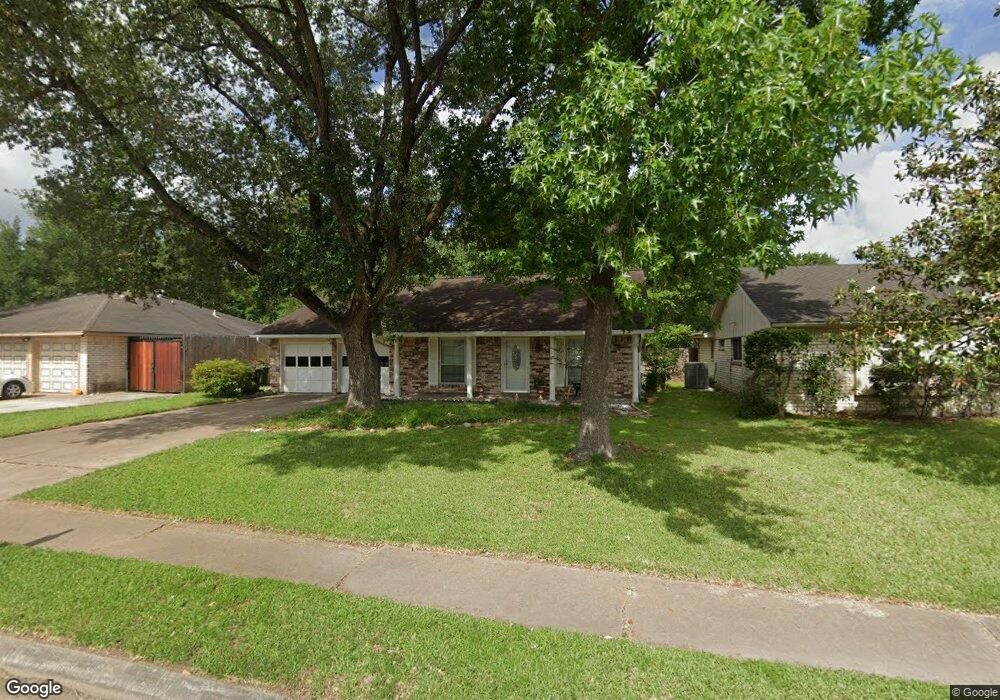
9007 Landwood Dr Houston, TX 77040
Greater Inwood NeighborhoodEstimated Value: $232,183 - $246,000
3
Beds
2
Baths
1,623
Sq Ft
$148/Sq Ft
Est. Value
About This Home
This home is located at 9007 Landwood Dr, Houston, TX 77040 and is currently estimated at $239,546, approximately $147 per square foot. 9007 Landwood Dr is a home located in Harris County with nearby schools including Holbrook Elementary School, Dean Middle School, and Jersey Village High School.
Ownership History
Date
Name
Owned For
Owner Type
Purchase Details
Closed on
May 11, 2024
Sold by
Vu Nguyen Hoang and Nguyen Trang T
Bought by
Vu Nguyen H
Current Estimated Value
Purchase Details
Closed on
Jun 5, 2014
Sold by
Burchard Brenda S and Burchard Dale L
Bought by
Vu Nguyen Hoang and Nguyen Trang T
Home Financials for this Owner
Home Financials are based on the most recent Mortgage that was taken out on this home.
Original Mortgage
$72,000
Interest Rate
4.38%
Mortgage Type
New Conventional
Purchase Details
Closed on
Jun 25, 2013
Sold by
Bentley Don C and Bentley Melba R
Bought by
Burchard Brenda S and Burchard Dale L
Home Financials for this Owner
Home Financials are based on the most recent Mortgage that was taken out on this home.
Original Mortgage
$75,600
Interest Rate
3.54%
Mortgage Type
New Conventional
Create a Home Valuation Report for This Property
The Home Valuation Report is an in-depth analysis detailing your home's value as well as a comparison with similar homes in the area
Home Values in the Area
Average Home Value in this Area
Purchase History
| Date | Buyer | Sale Price | Title Company |
|---|---|---|---|
| Vu Nguyen H | -- | None Listed On Document | |
| Vu Nguyen Hoang | -- | None Available | |
| Burchard Brenda S | -- | None Available |
Source: Public Records
Mortgage History
| Date | Status | Borrower | Loan Amount |
|---|---|---|---|
| Previous Owner | Vu Nguyen Hoang | $72,000 | |
| Previous Owner | Burchard Brenda S | $75,600 |
Source: Public Records
Tax History Compared to Growth
Tax History
| Year | Tax Paid | Tax Assessment Tax Assessment Total Assessment is a certain percentage of the fair market value that is determined by local assessors to be the total taxable value of land and additions on the property. | Land | Improvement |
|---|---|---|---|---|
| 2025 | $81 | $211,437 | $60,865 | $150,572 |
| 2024 | $81 | $193,084 | $60,865 | $132,219 |
| 2023 | $81 | $220,251 | $60,865 | $159,386 |
| 2022 | $4,217 | $191,104 | $50,829 | $140,275 |
| 2021 | $4,127 | $160,174 | $50,829 | $109,345 |
| 2020 | $3,866 | $166,640 | $35,750 | $130,890 |
| 2019 | $3,658 | $144,000 | $21,450 | $122,550 |
| 2018 | $1,022 | $120,000 | $21,450 | $98,550 |
| 2017 | $3,323 | $120,000 | $21,450 | $98,550 |
| 2016 | $3,473 | $127,000 | $21,450 | $105,550 |
| 2015 | $2,136 | $114,000 | $17,875 | $96,125 |
| 2014 | $2,136 | $103,683 | $17,875 | $85,808 |
Source: Public Records
Map
Nearby Homes
- 7218 Stonegate Dr
- 7259 Shady Arbor Ln
- 7318 Shady Grove Ln
- 8615 Black Tern Ln
- 6902 Anson Point Ln
- 8610 Twillingate Ln
- 9350 Guywood St
- 9331 Deanwood St
- 6407 Deirdre Anne Dr
- 7718 Breezeway St
- 9523 Vanwood St
- 7051 Majestic Oaks Dr
- 6310 Silver Chalice Dr
- 9207 Loren Ln
- 6338 Maple Hill Dr
- 6430 Pirtlewood Cir
- 9214 Woodland Oaks Dr
- 7218 Jadewood Dr Unit 770
- 7731 Deadwood Dr
- 7706 Deadwood Dr
- 9003 Landwood Dr
- 9011 Landwood Dr
- 7215 Woodfern Dr
- 7219 Woodfern Dr
- 8915 Landwood Dr
- 9006 Landwood Dr
- 9002 Landwood Dr
- 9010 Landwood Dr
- 7223 Woodfern Dr
- 8903 Landwood Dr
- 8914 Landwood Dr
- 7210 Woodfern Dr
- 7206 Woodfern Dr
- 9014 Landwood Dr
- 7214 Woodfern Dr
- 8910 Landwood Dr
- 8807 Landwood Dr
- 7227 Woodfern Dr
- 7218 Woodfern Dr
- 7202 Woodfern Dr